River Data
Map of River Channels in the Arctic 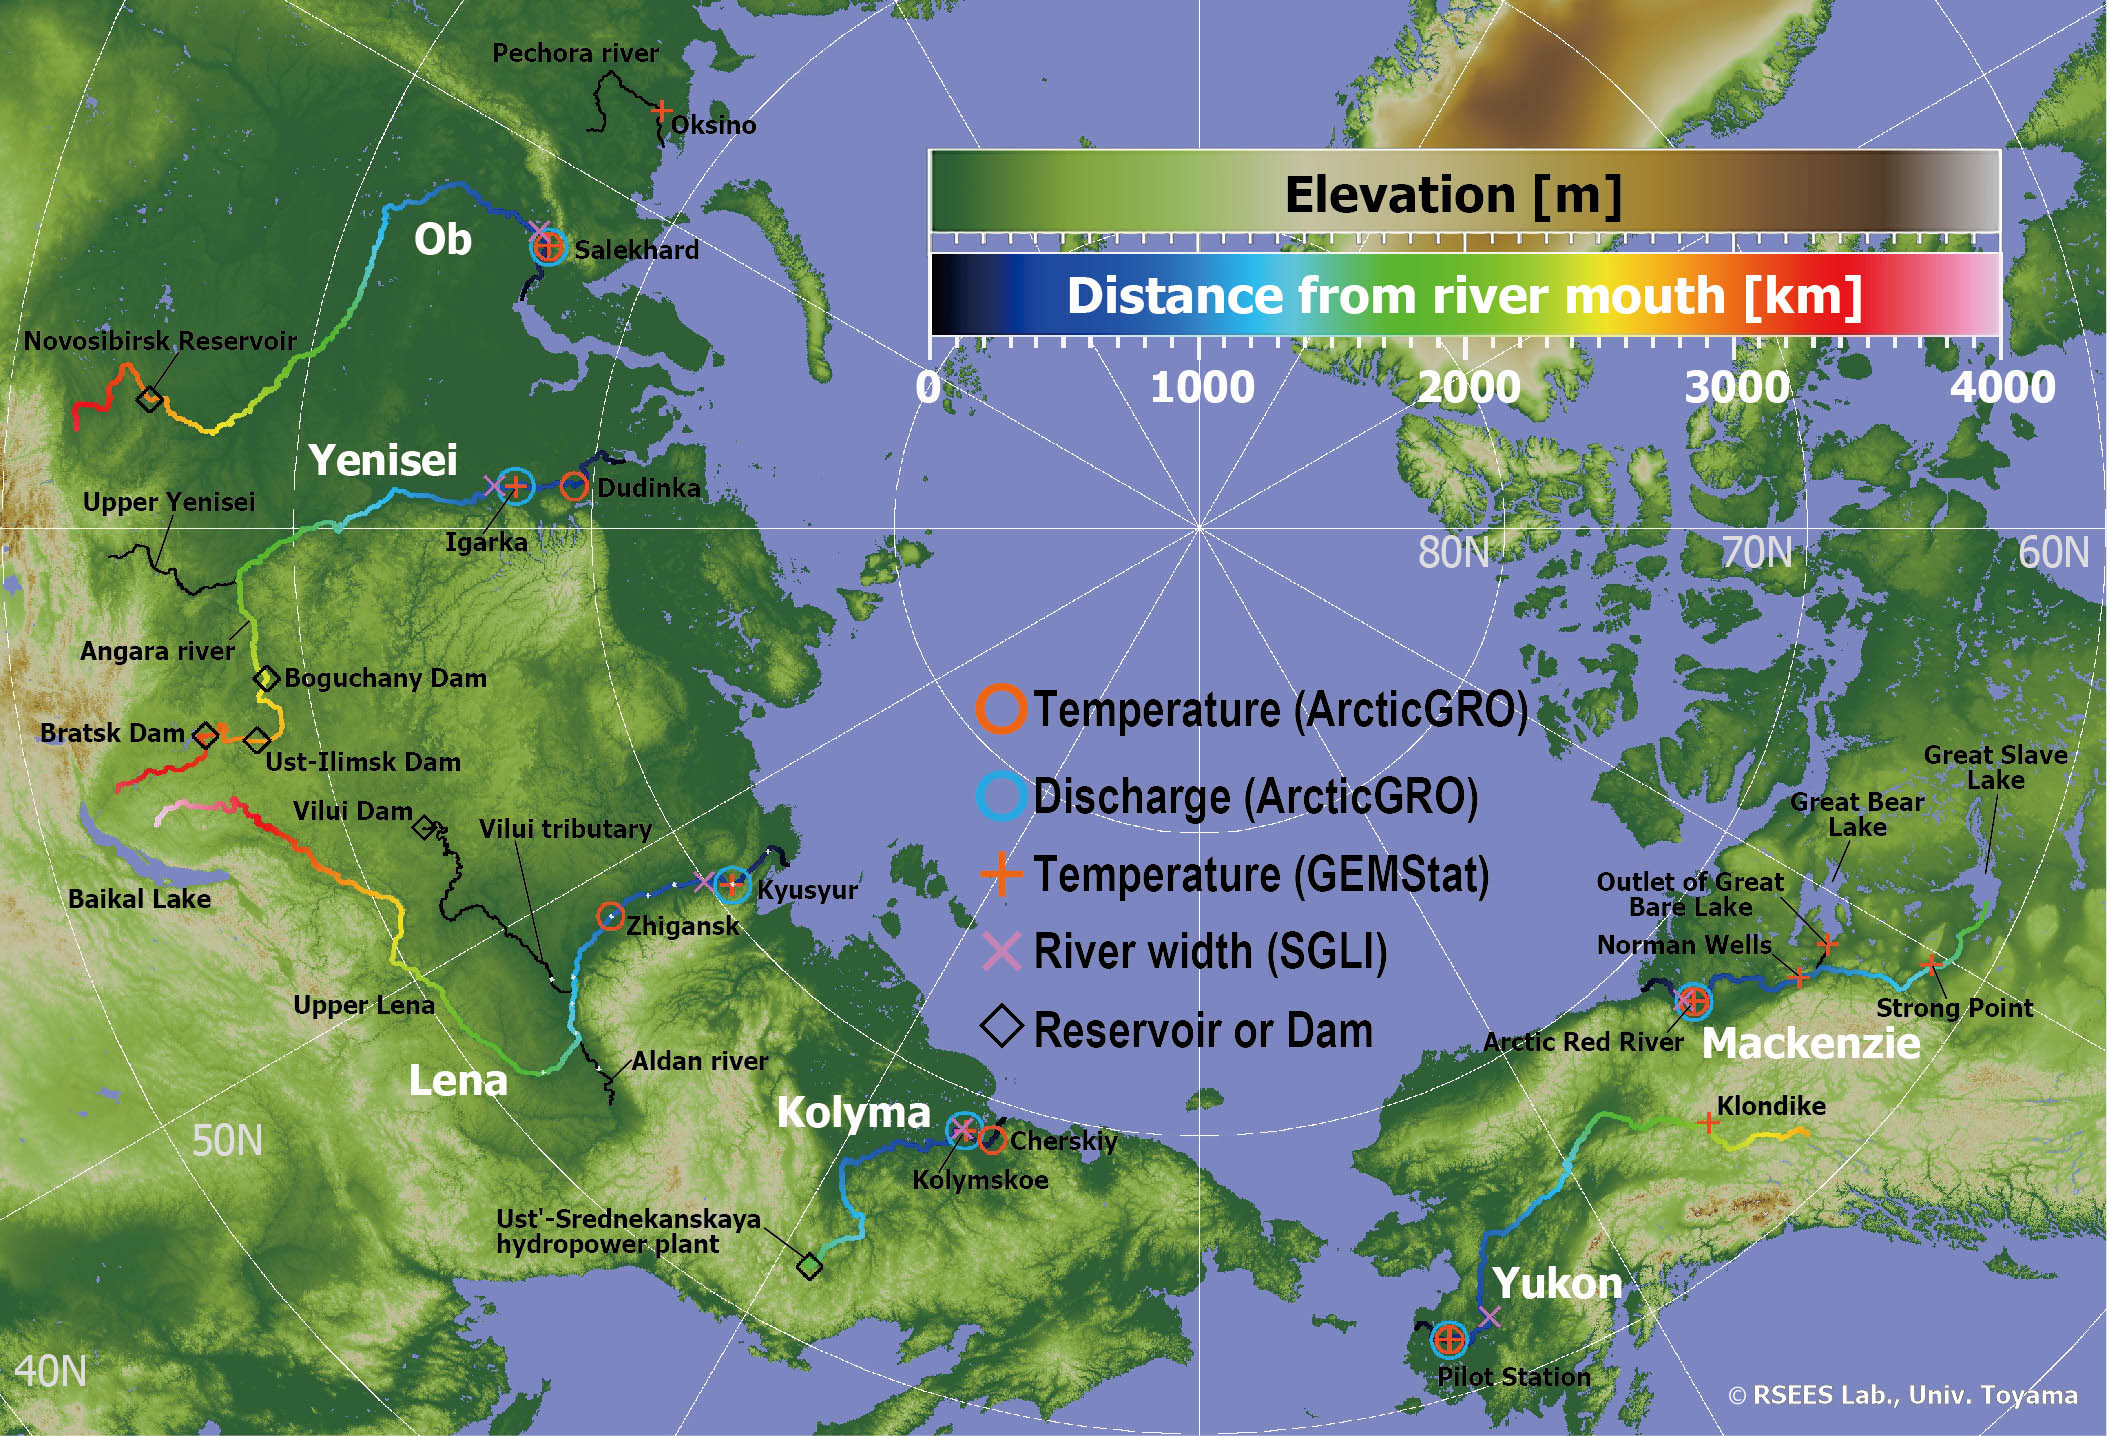
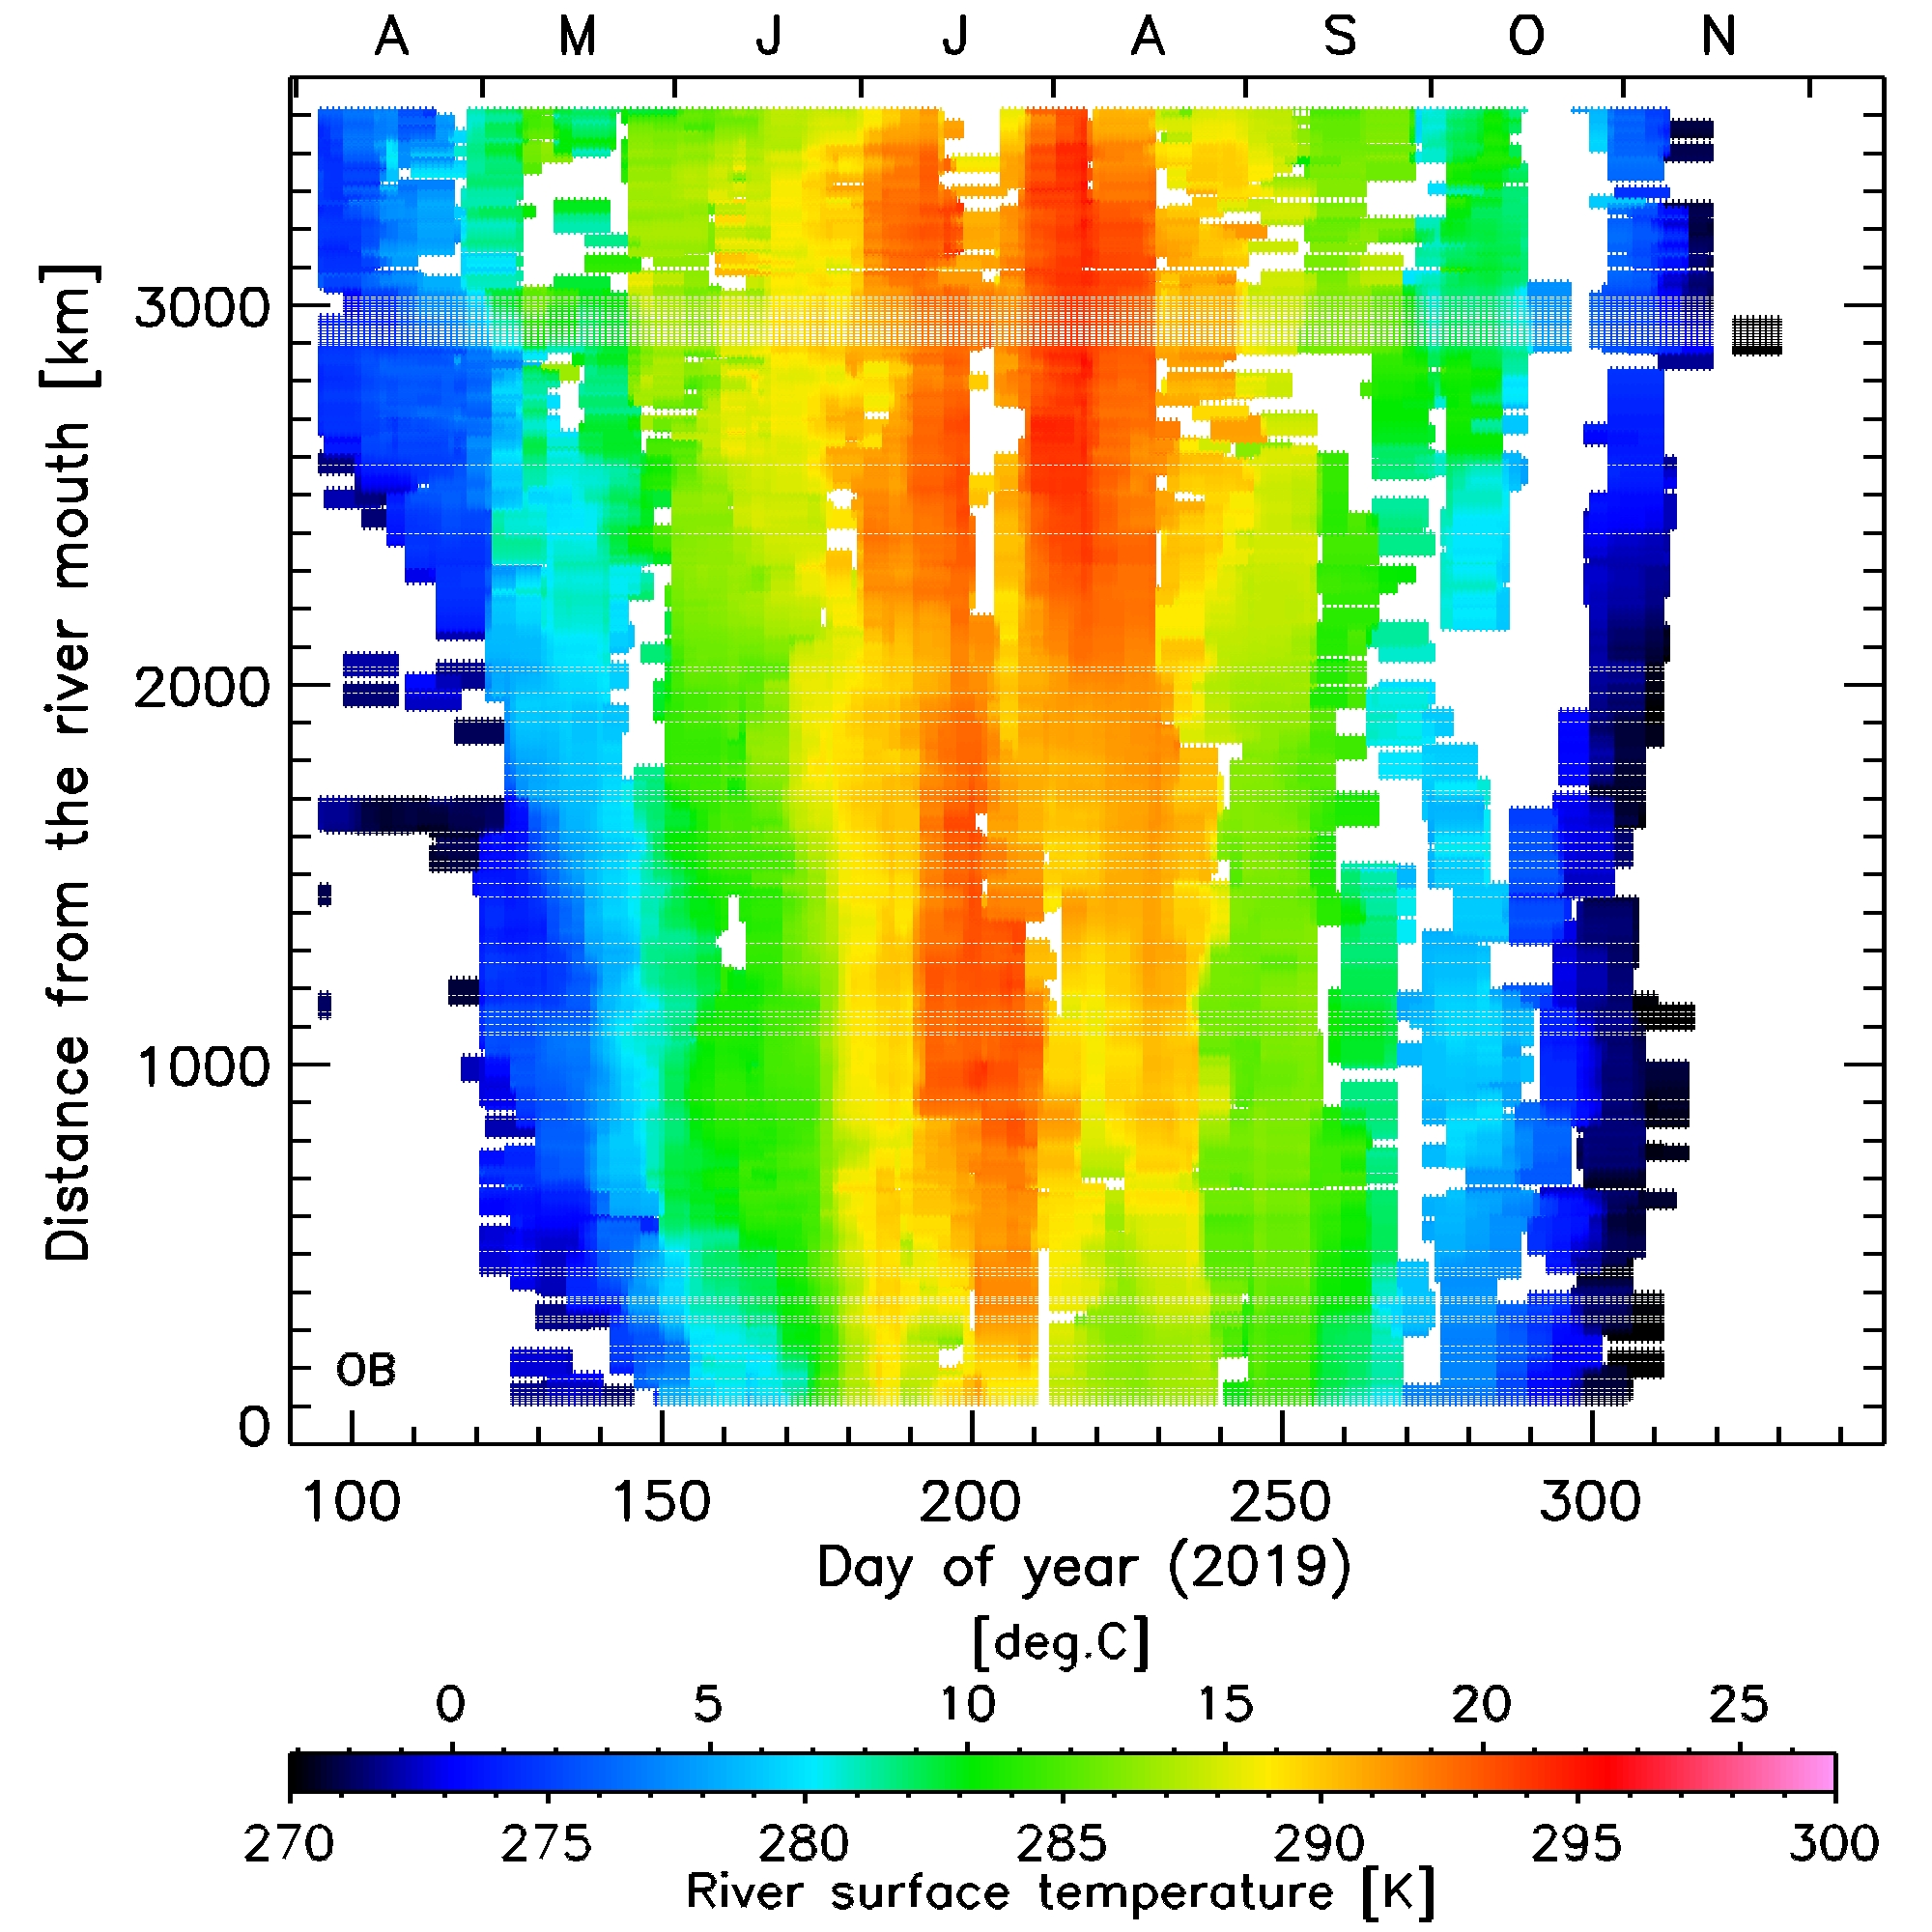
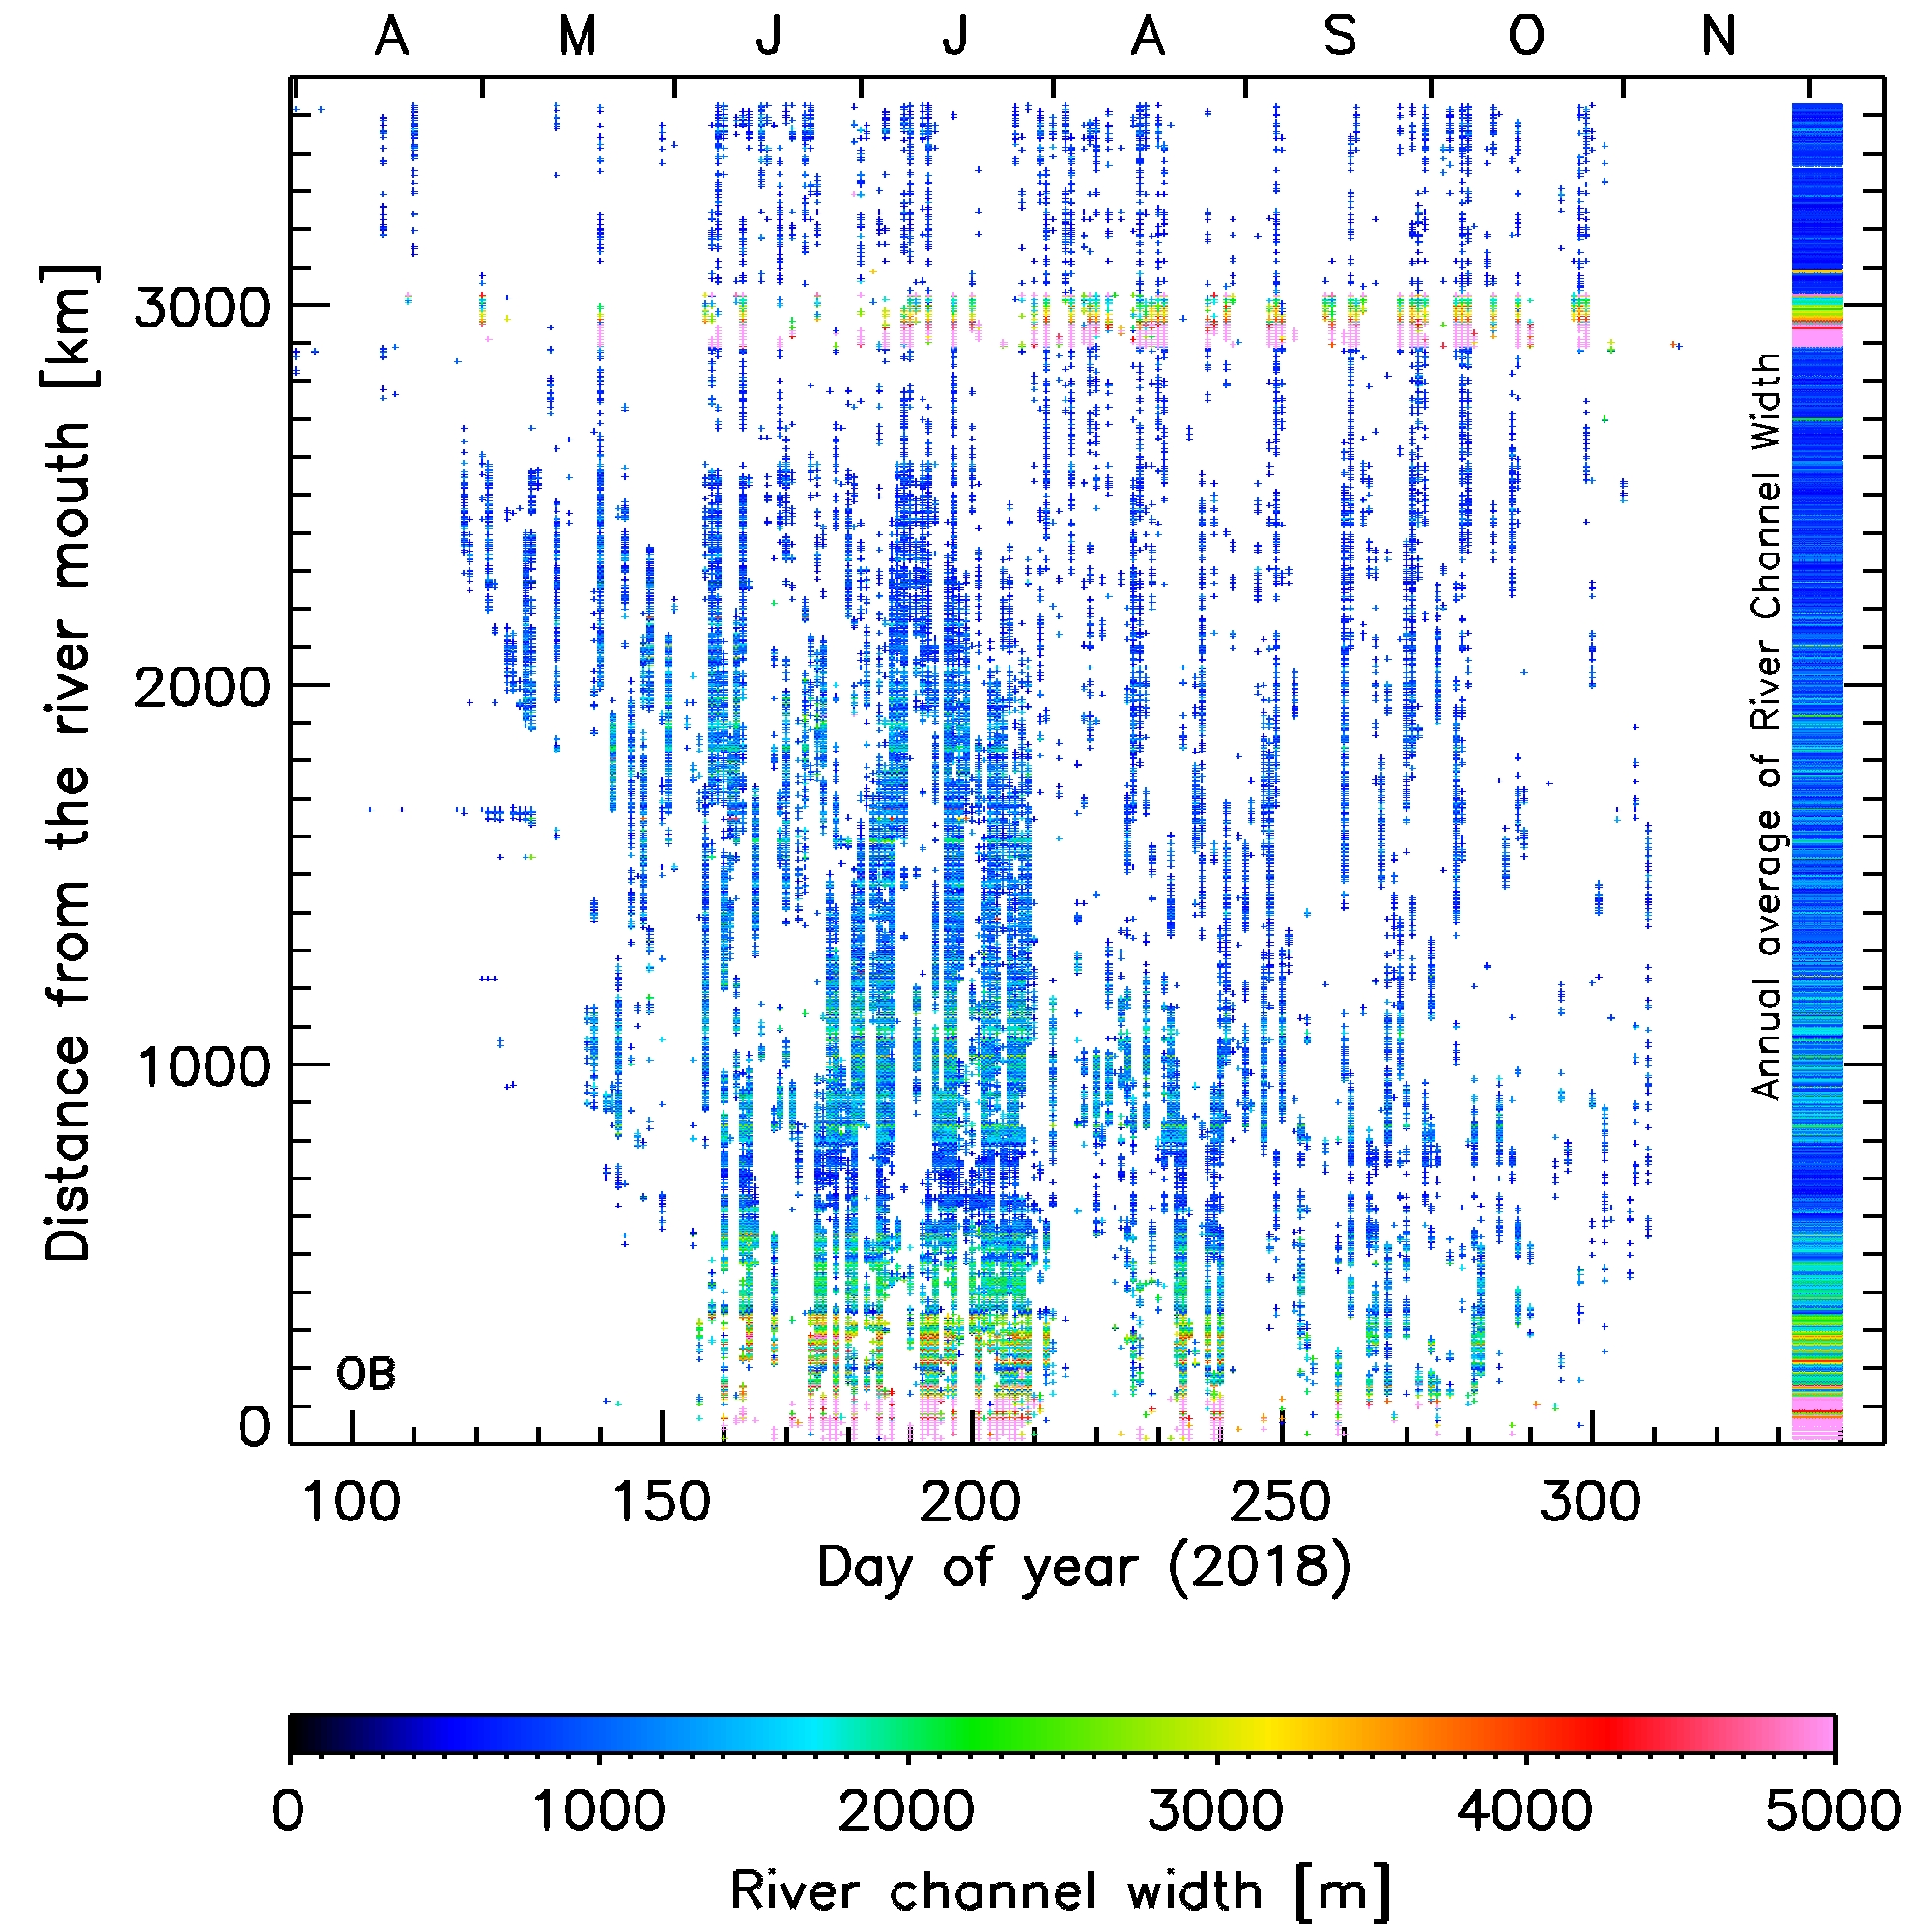
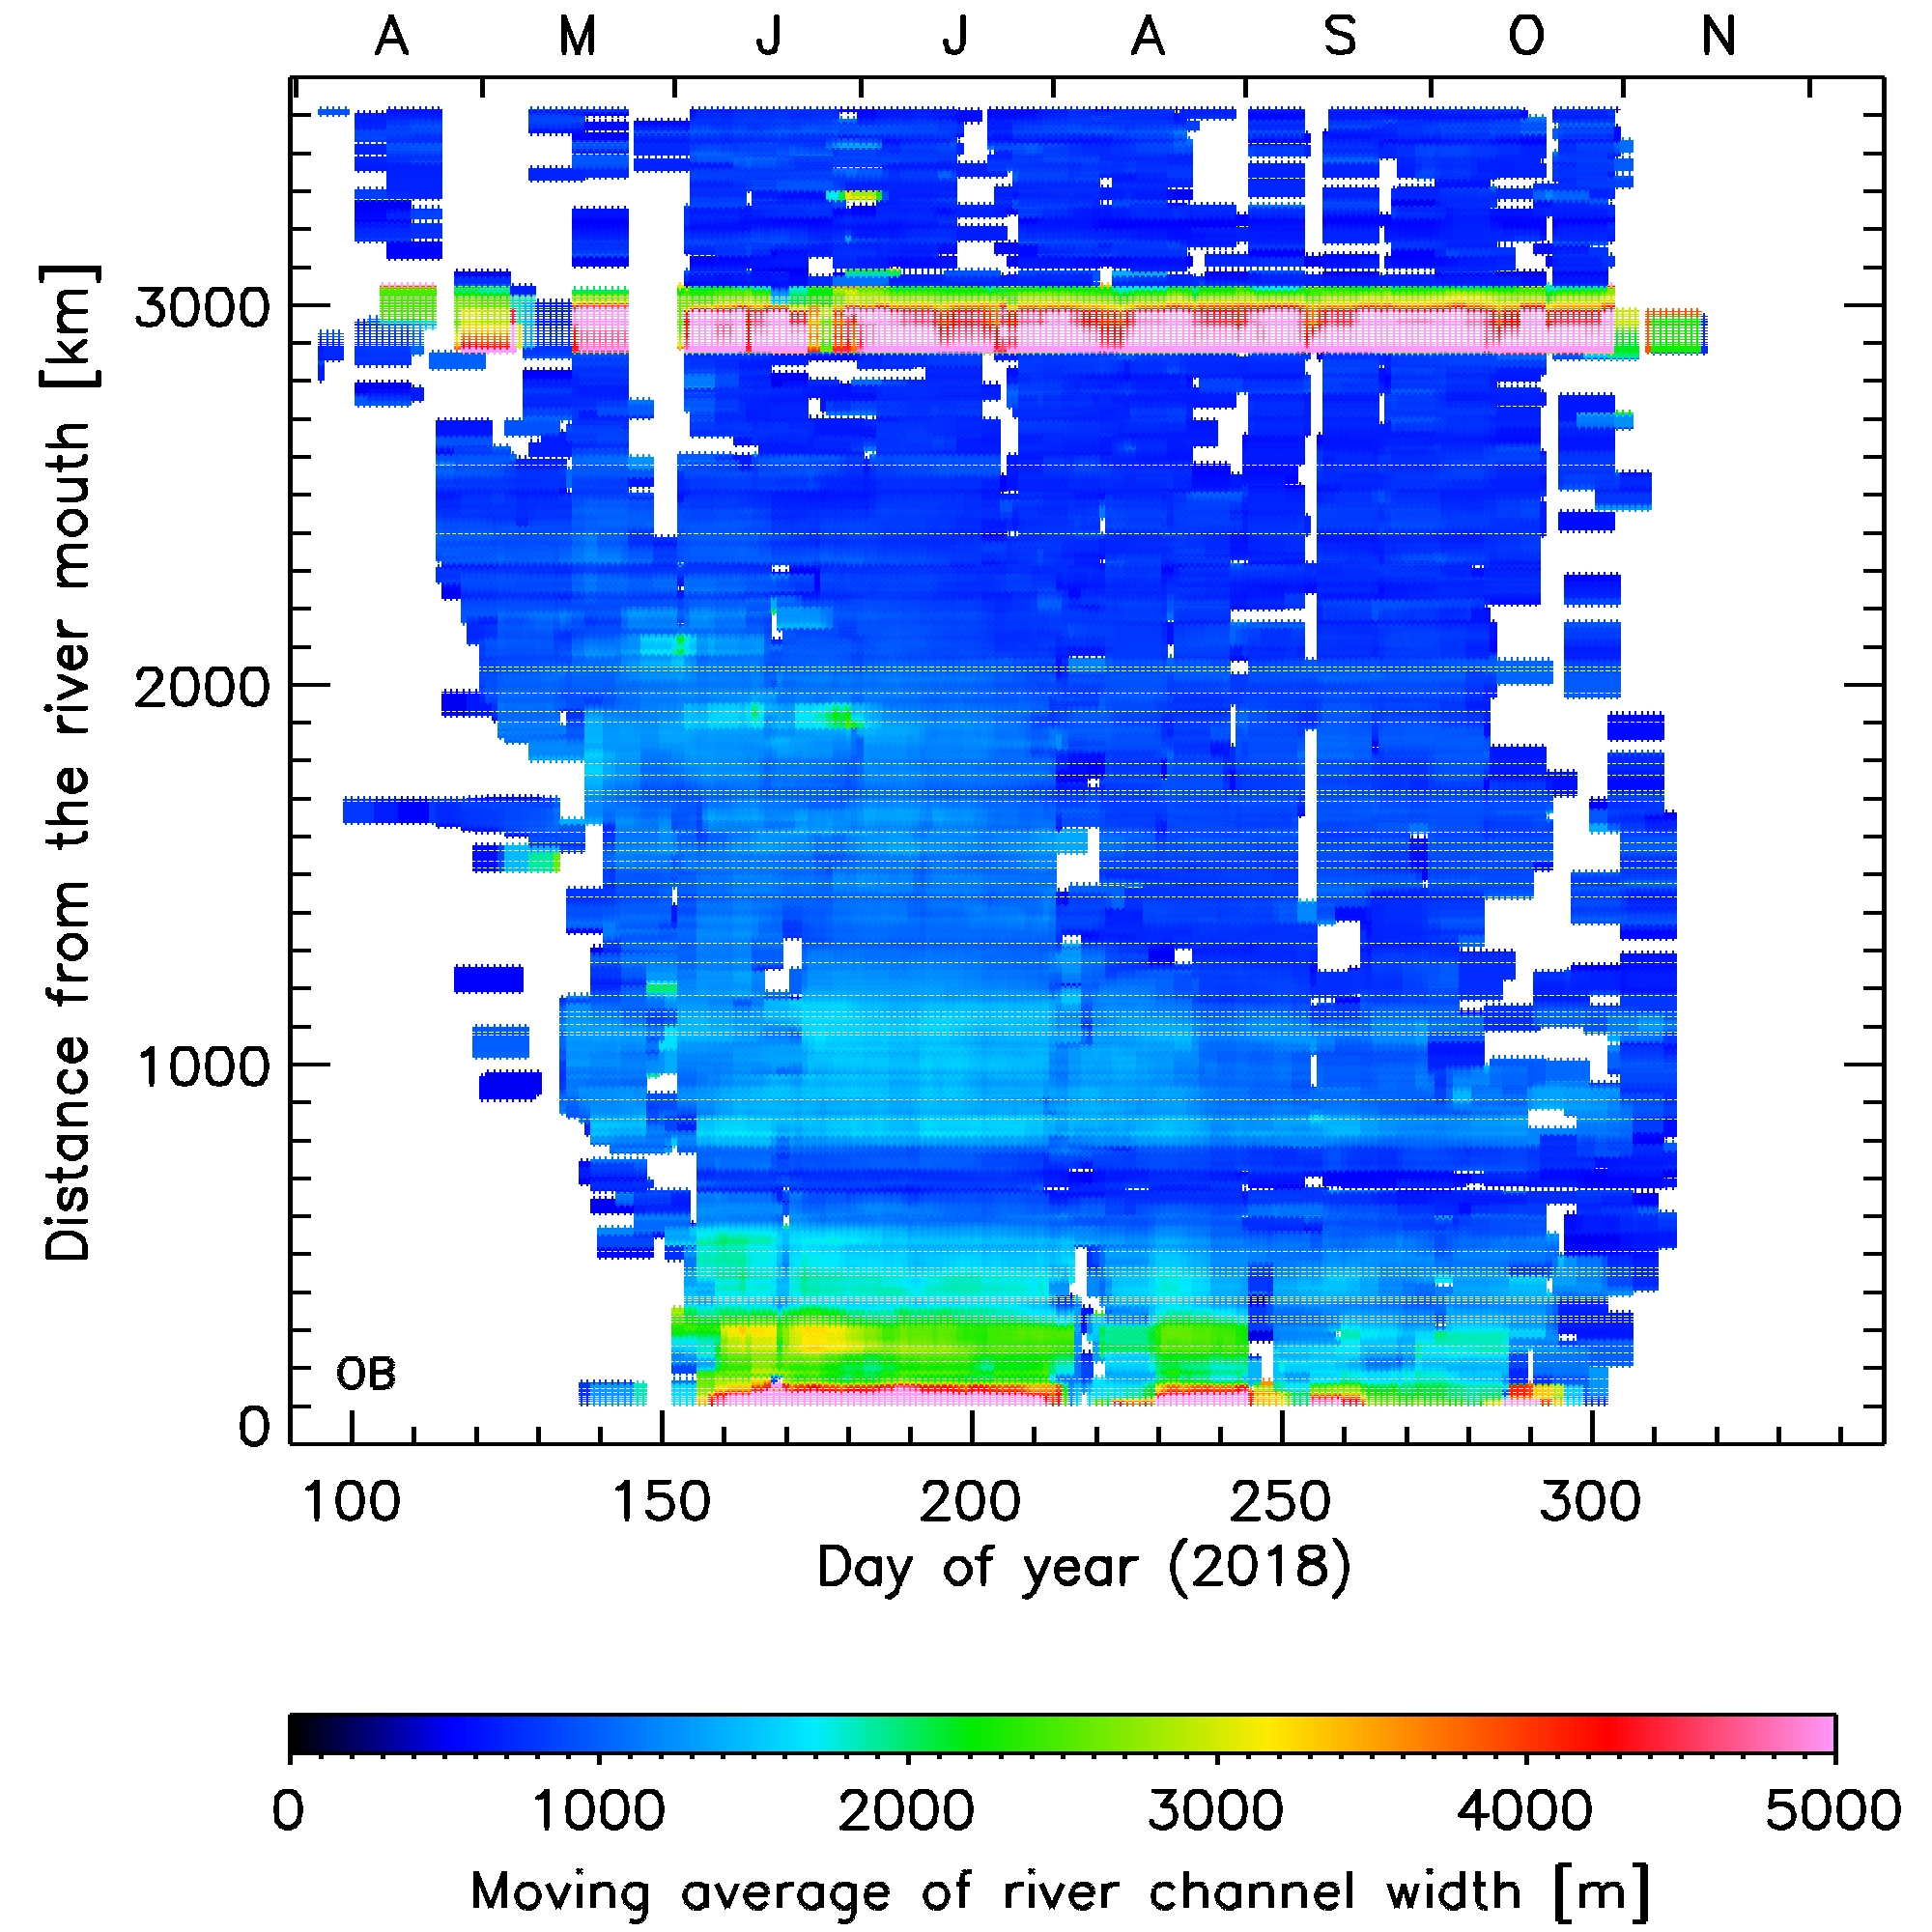
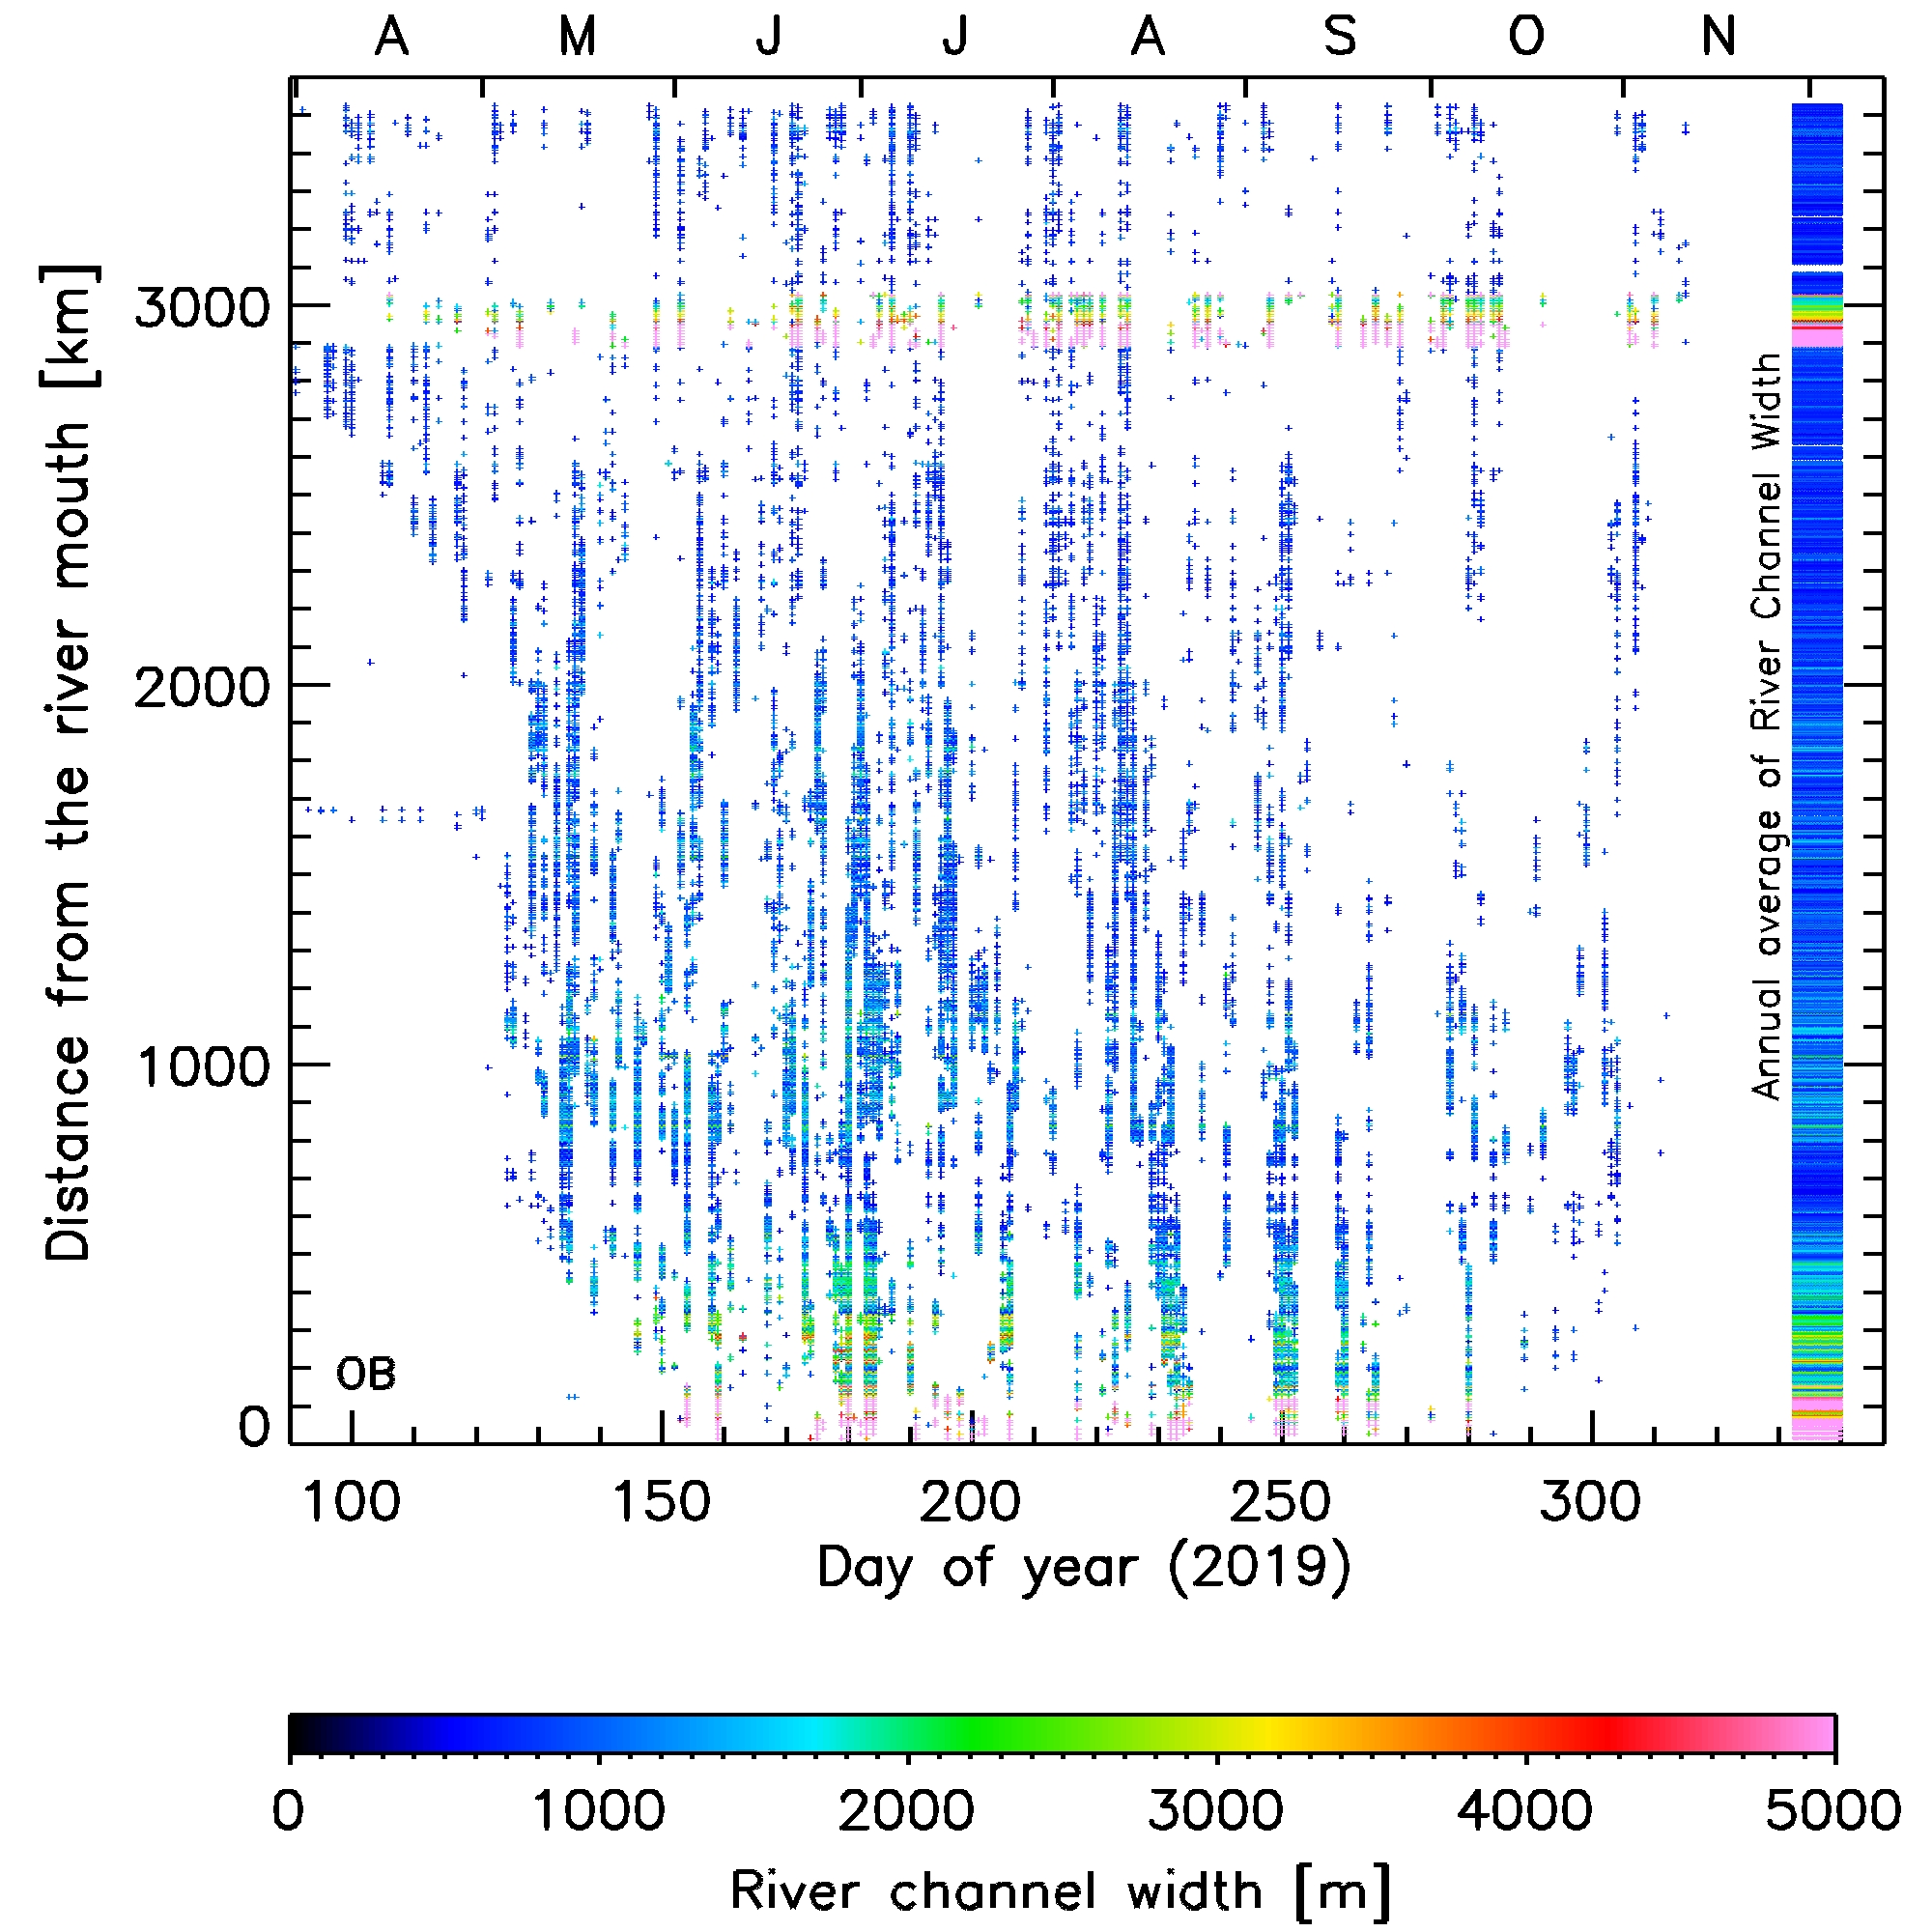
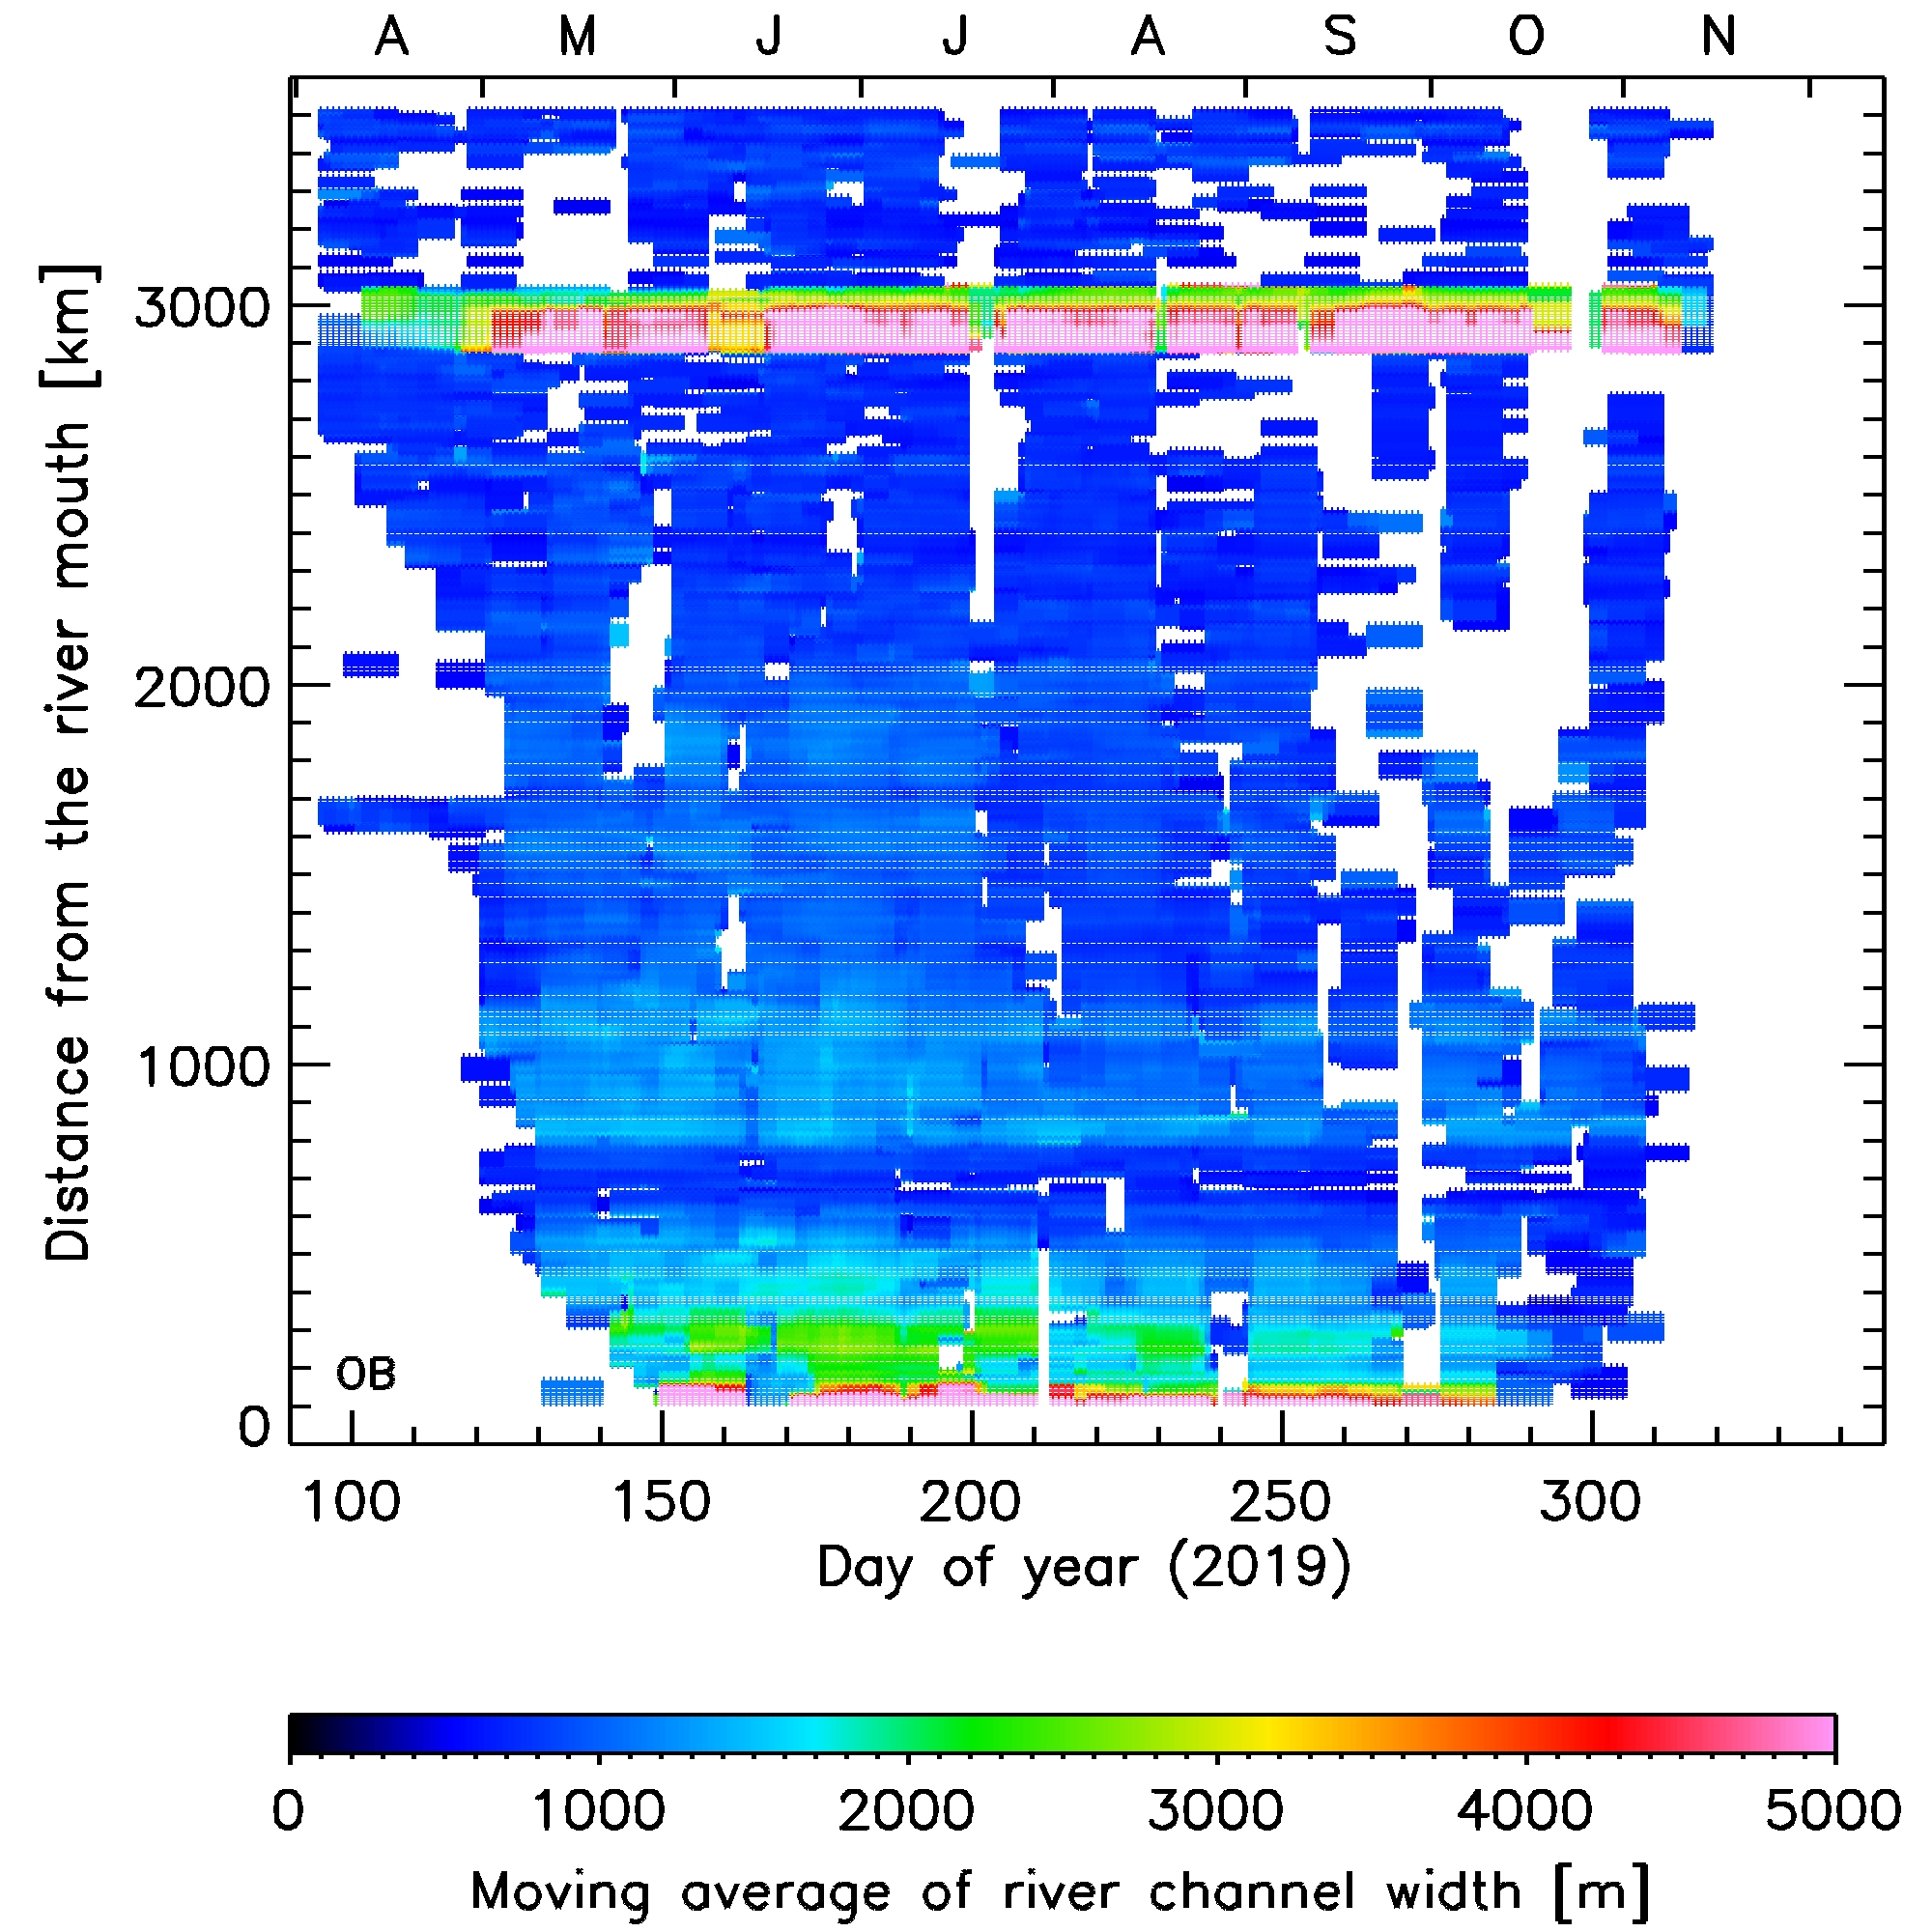
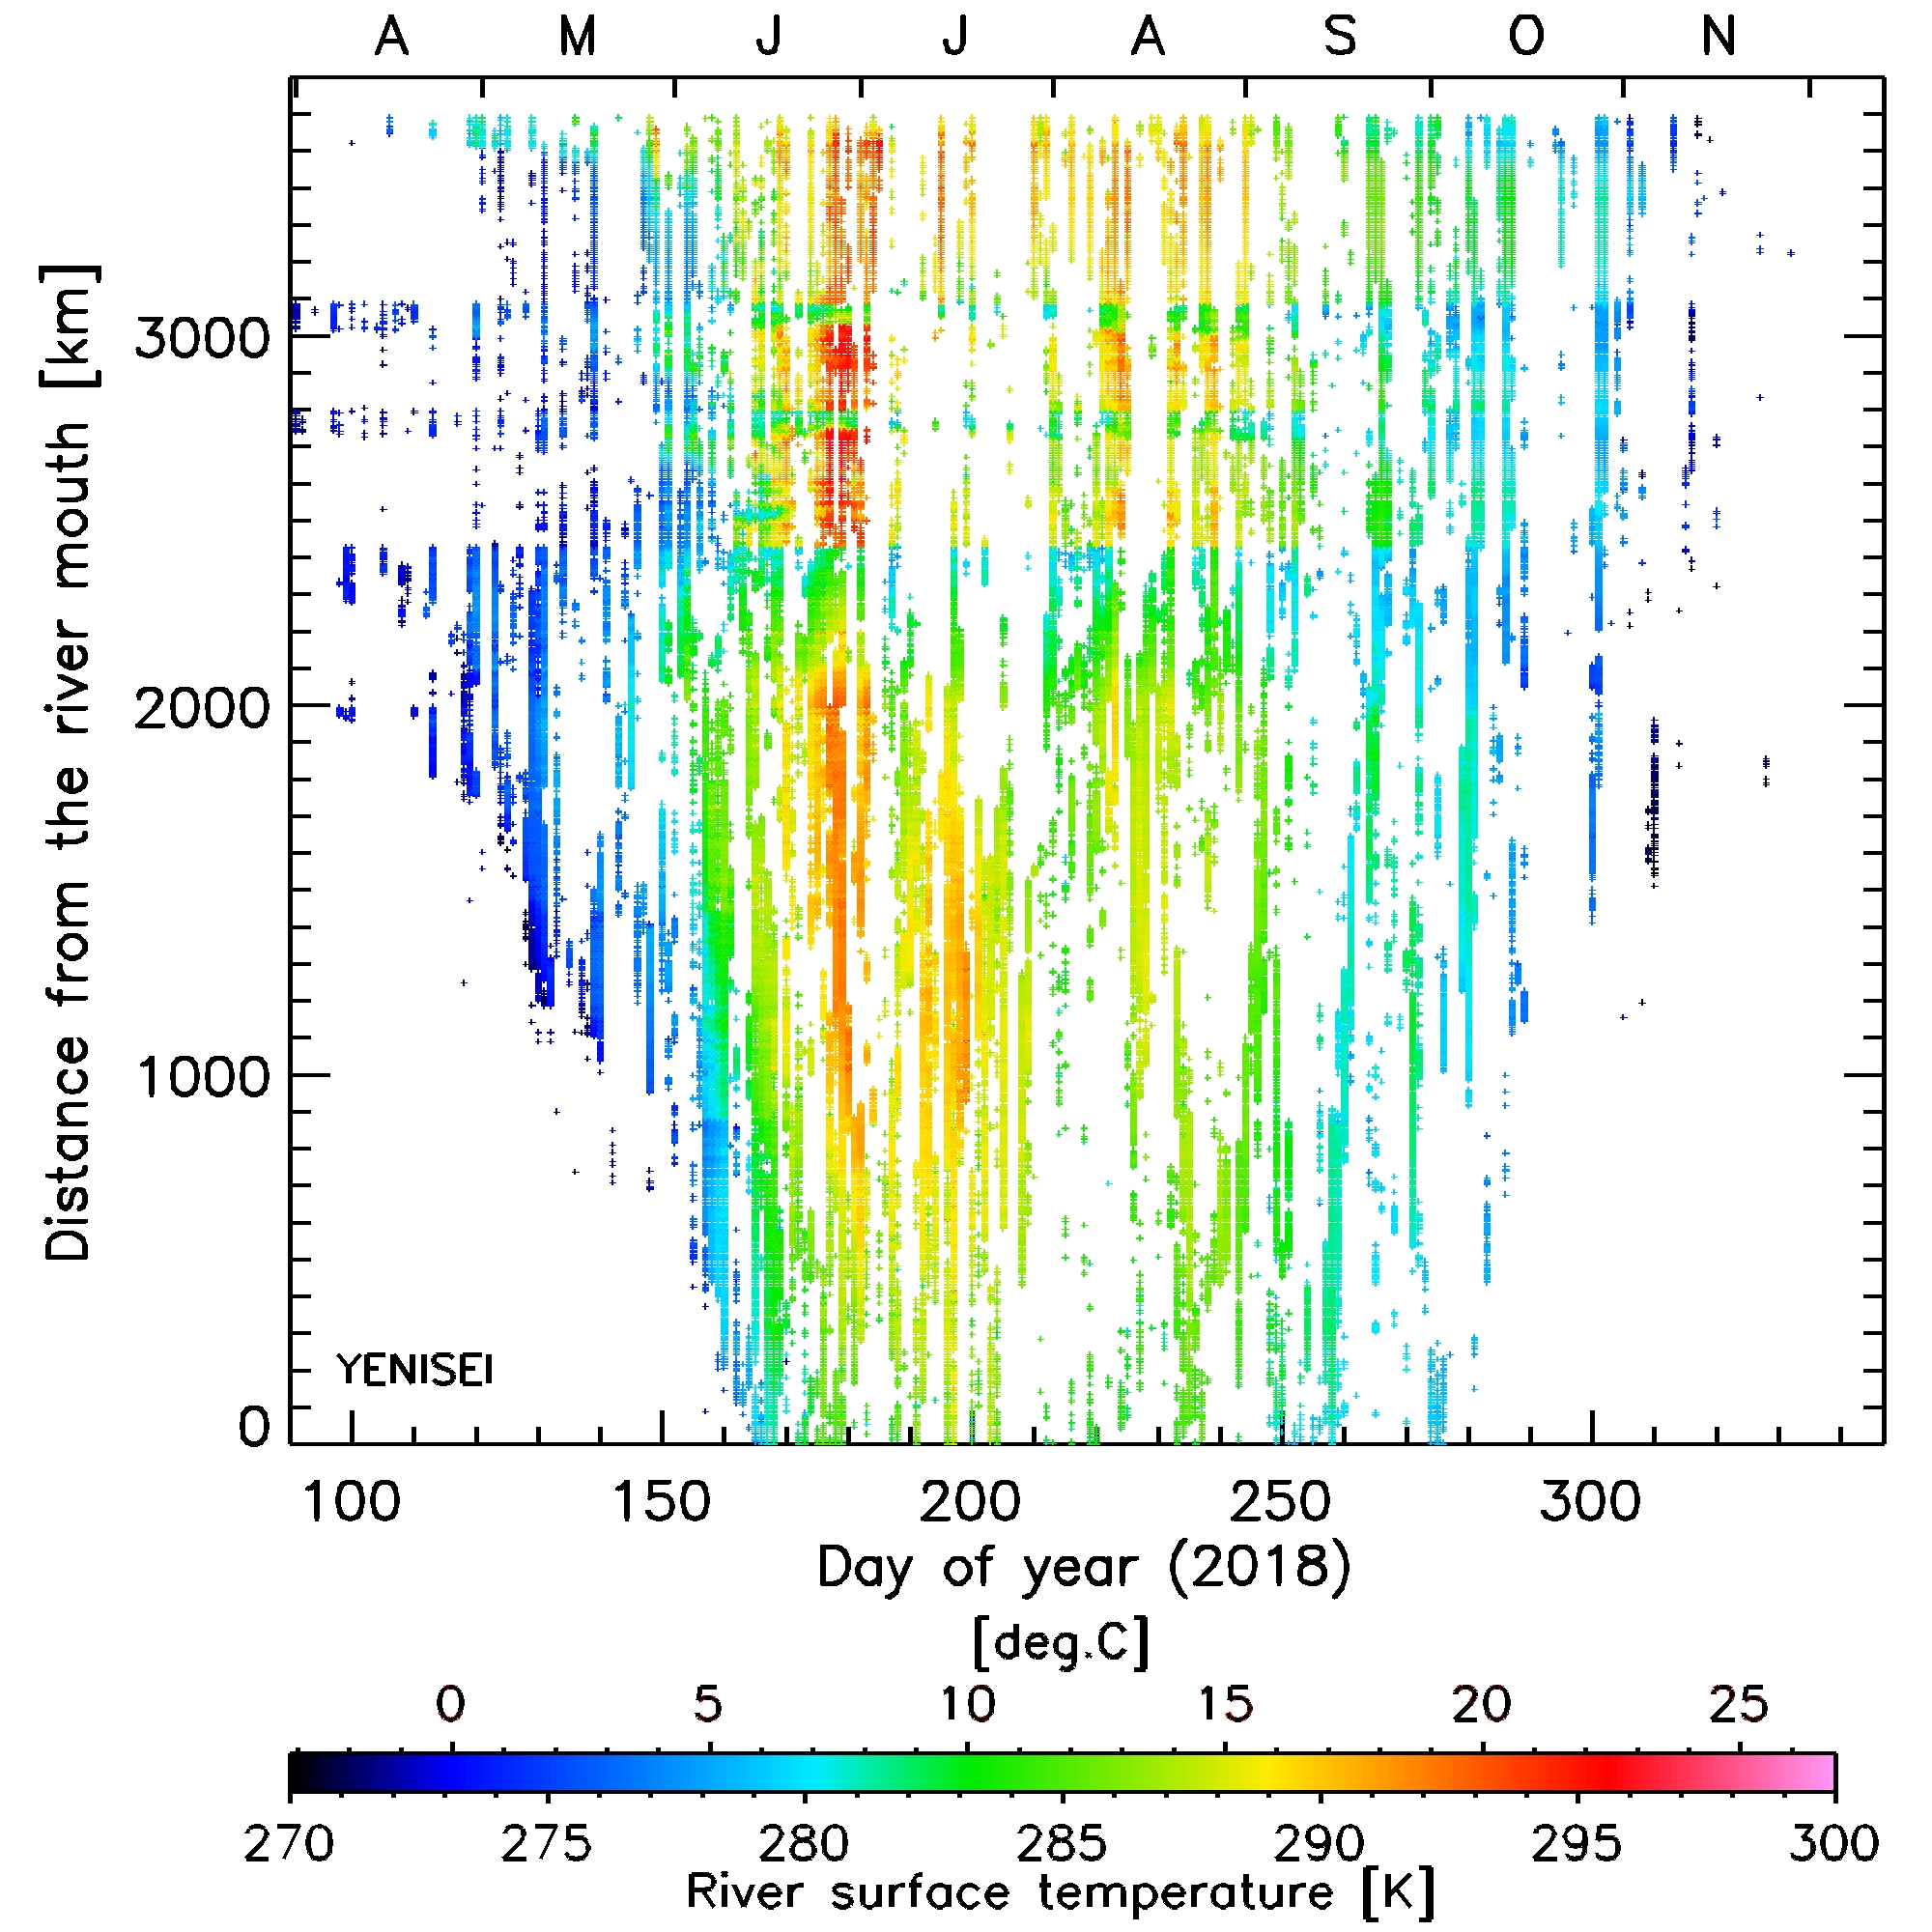
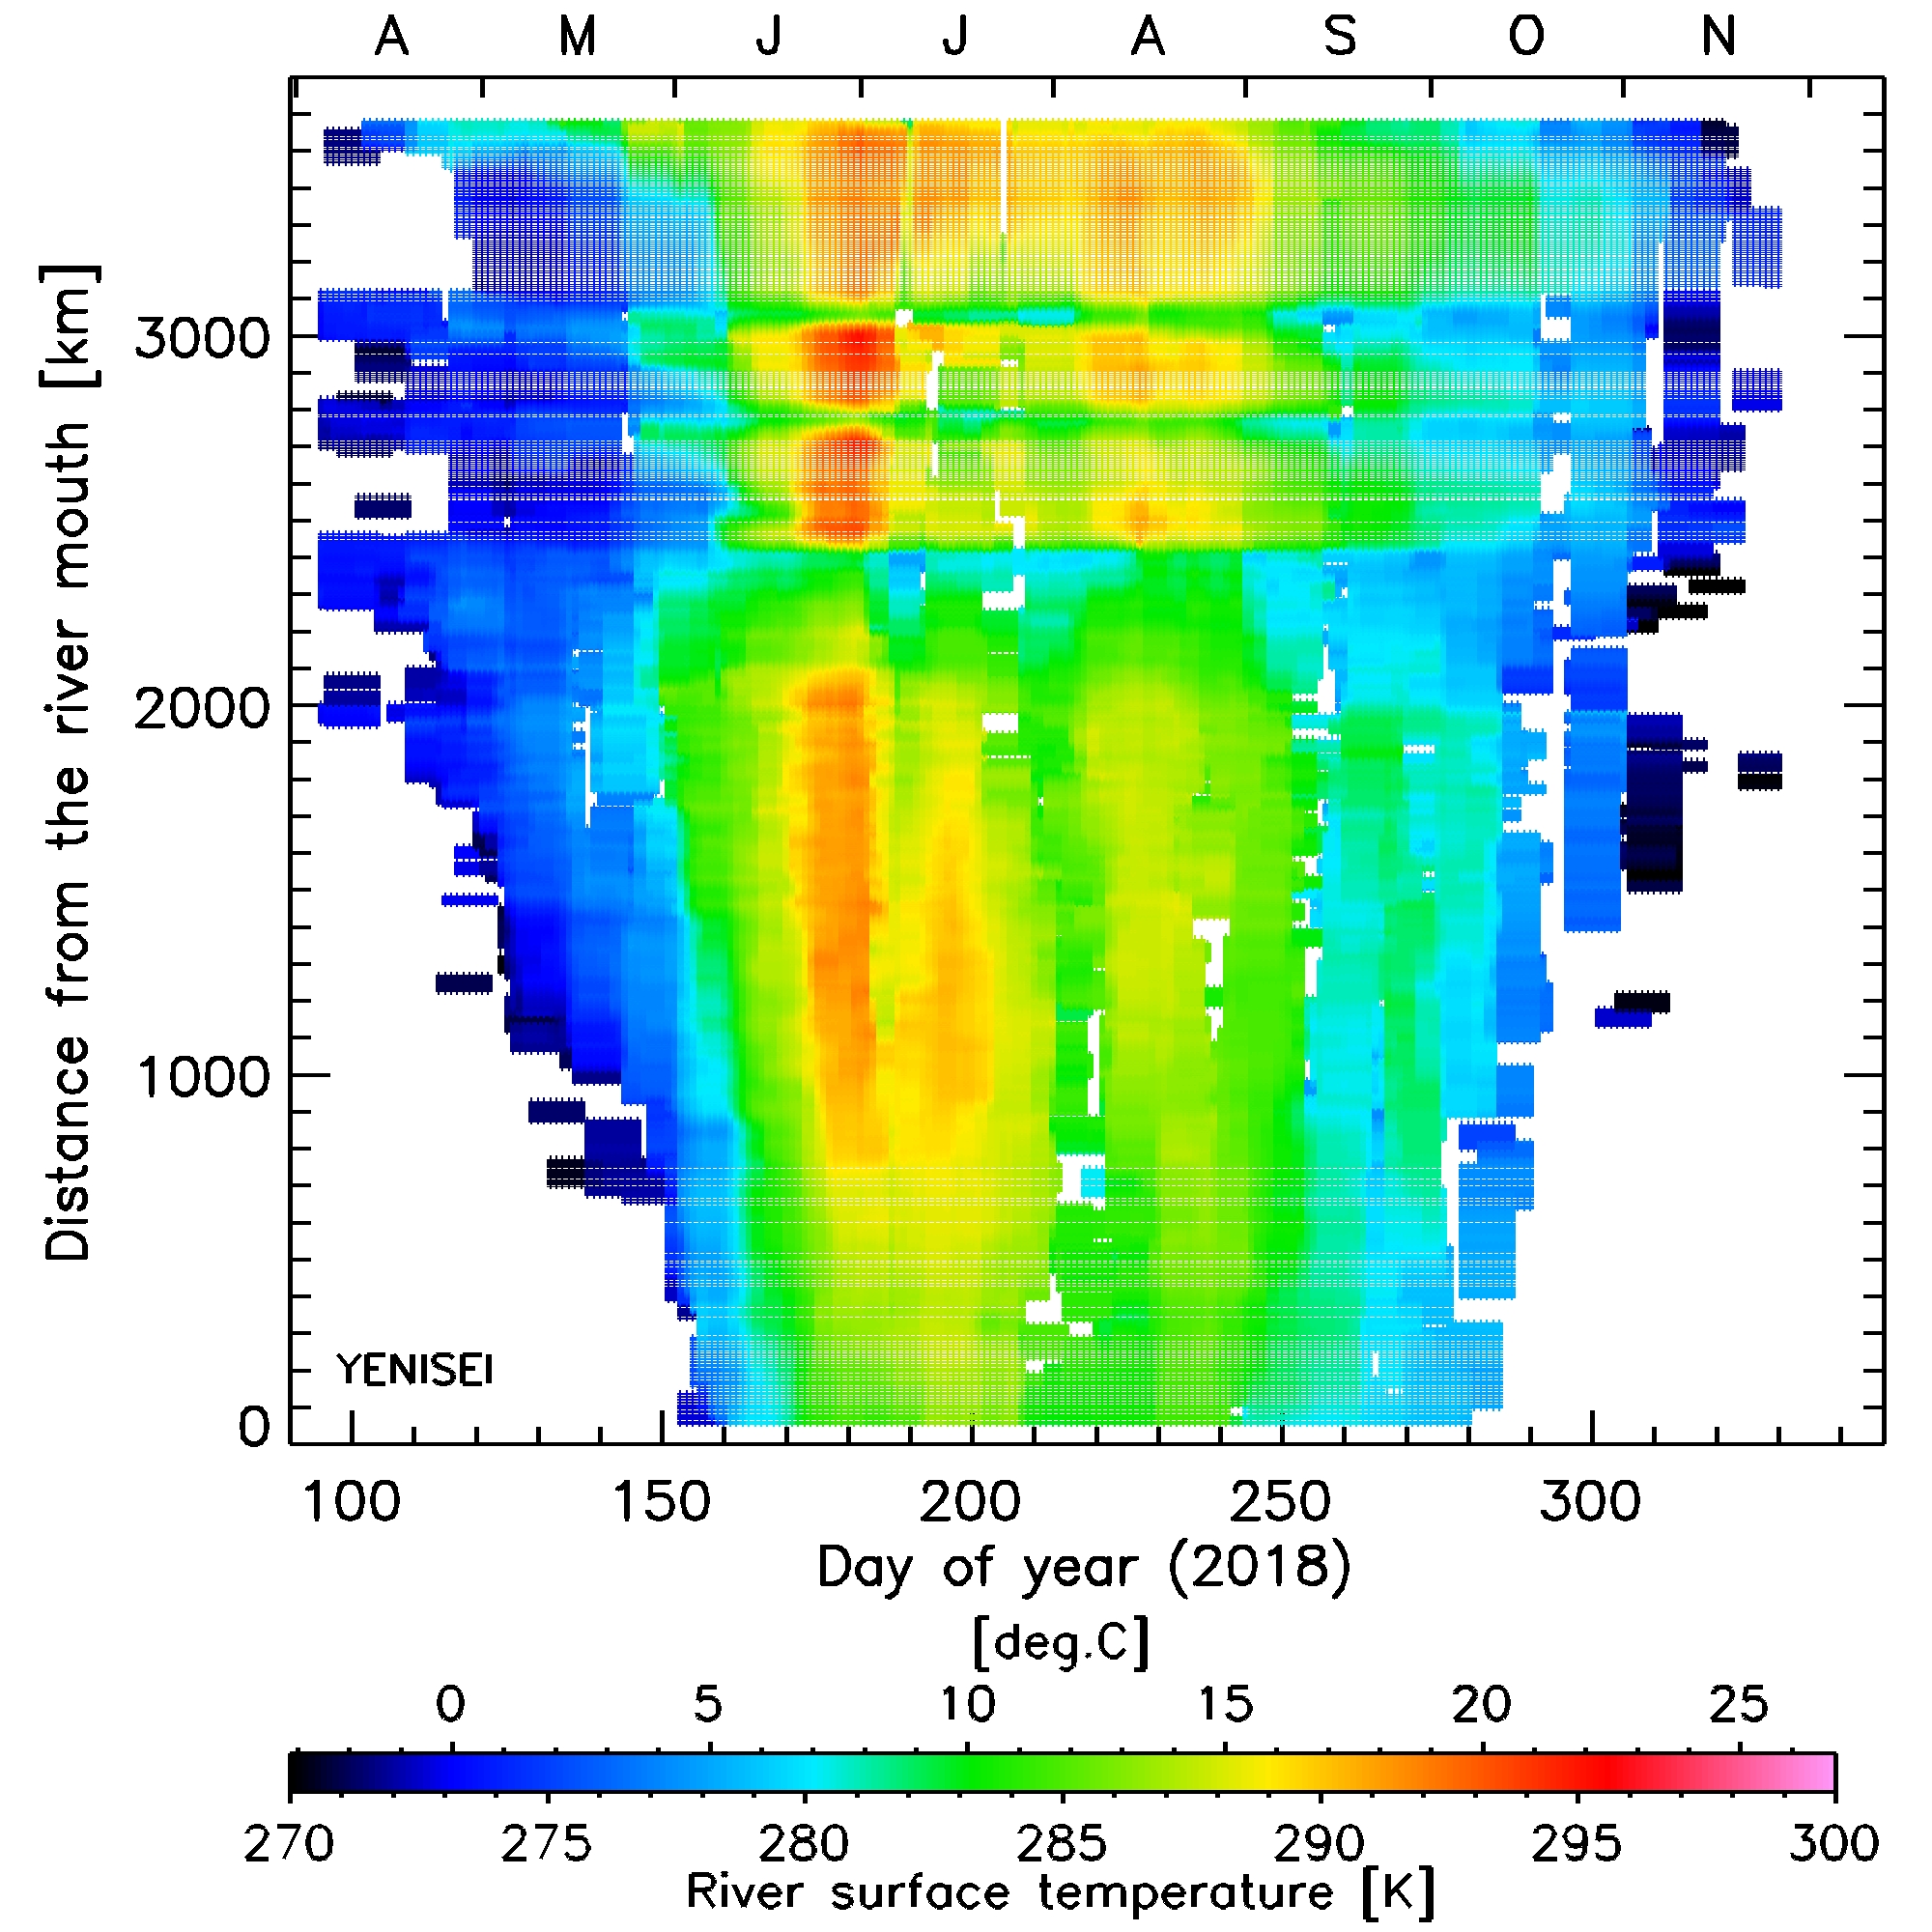
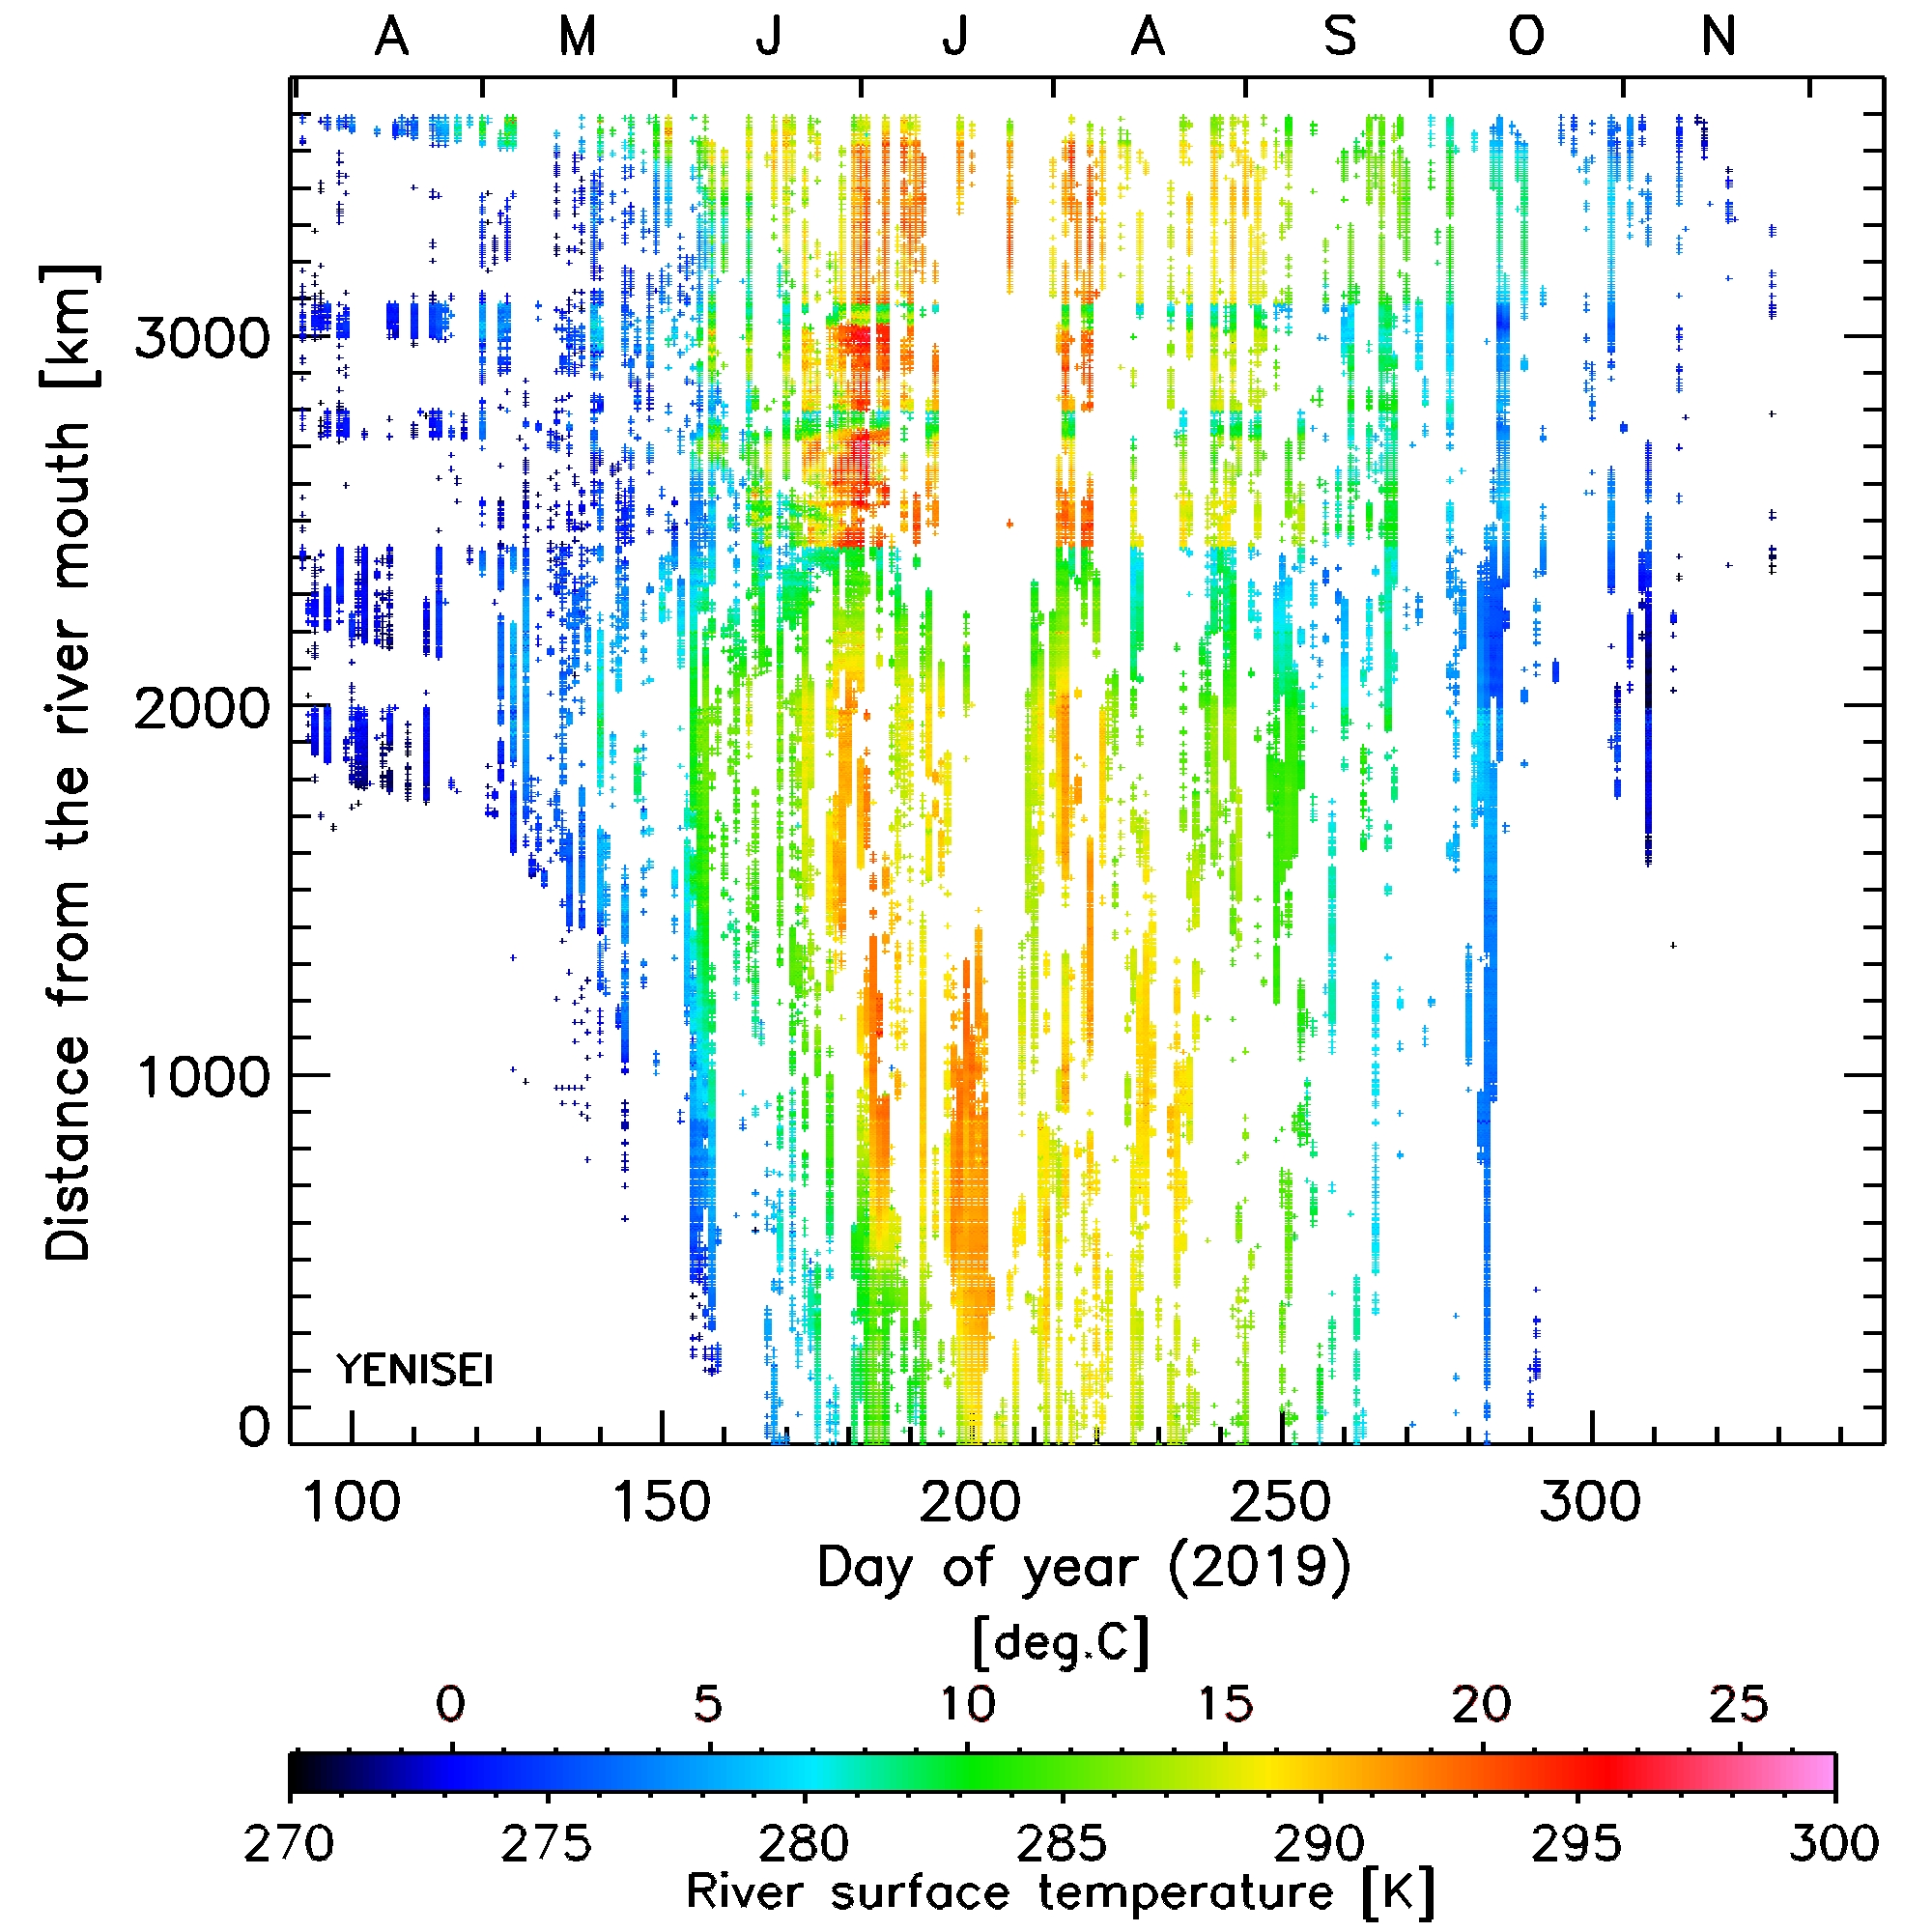
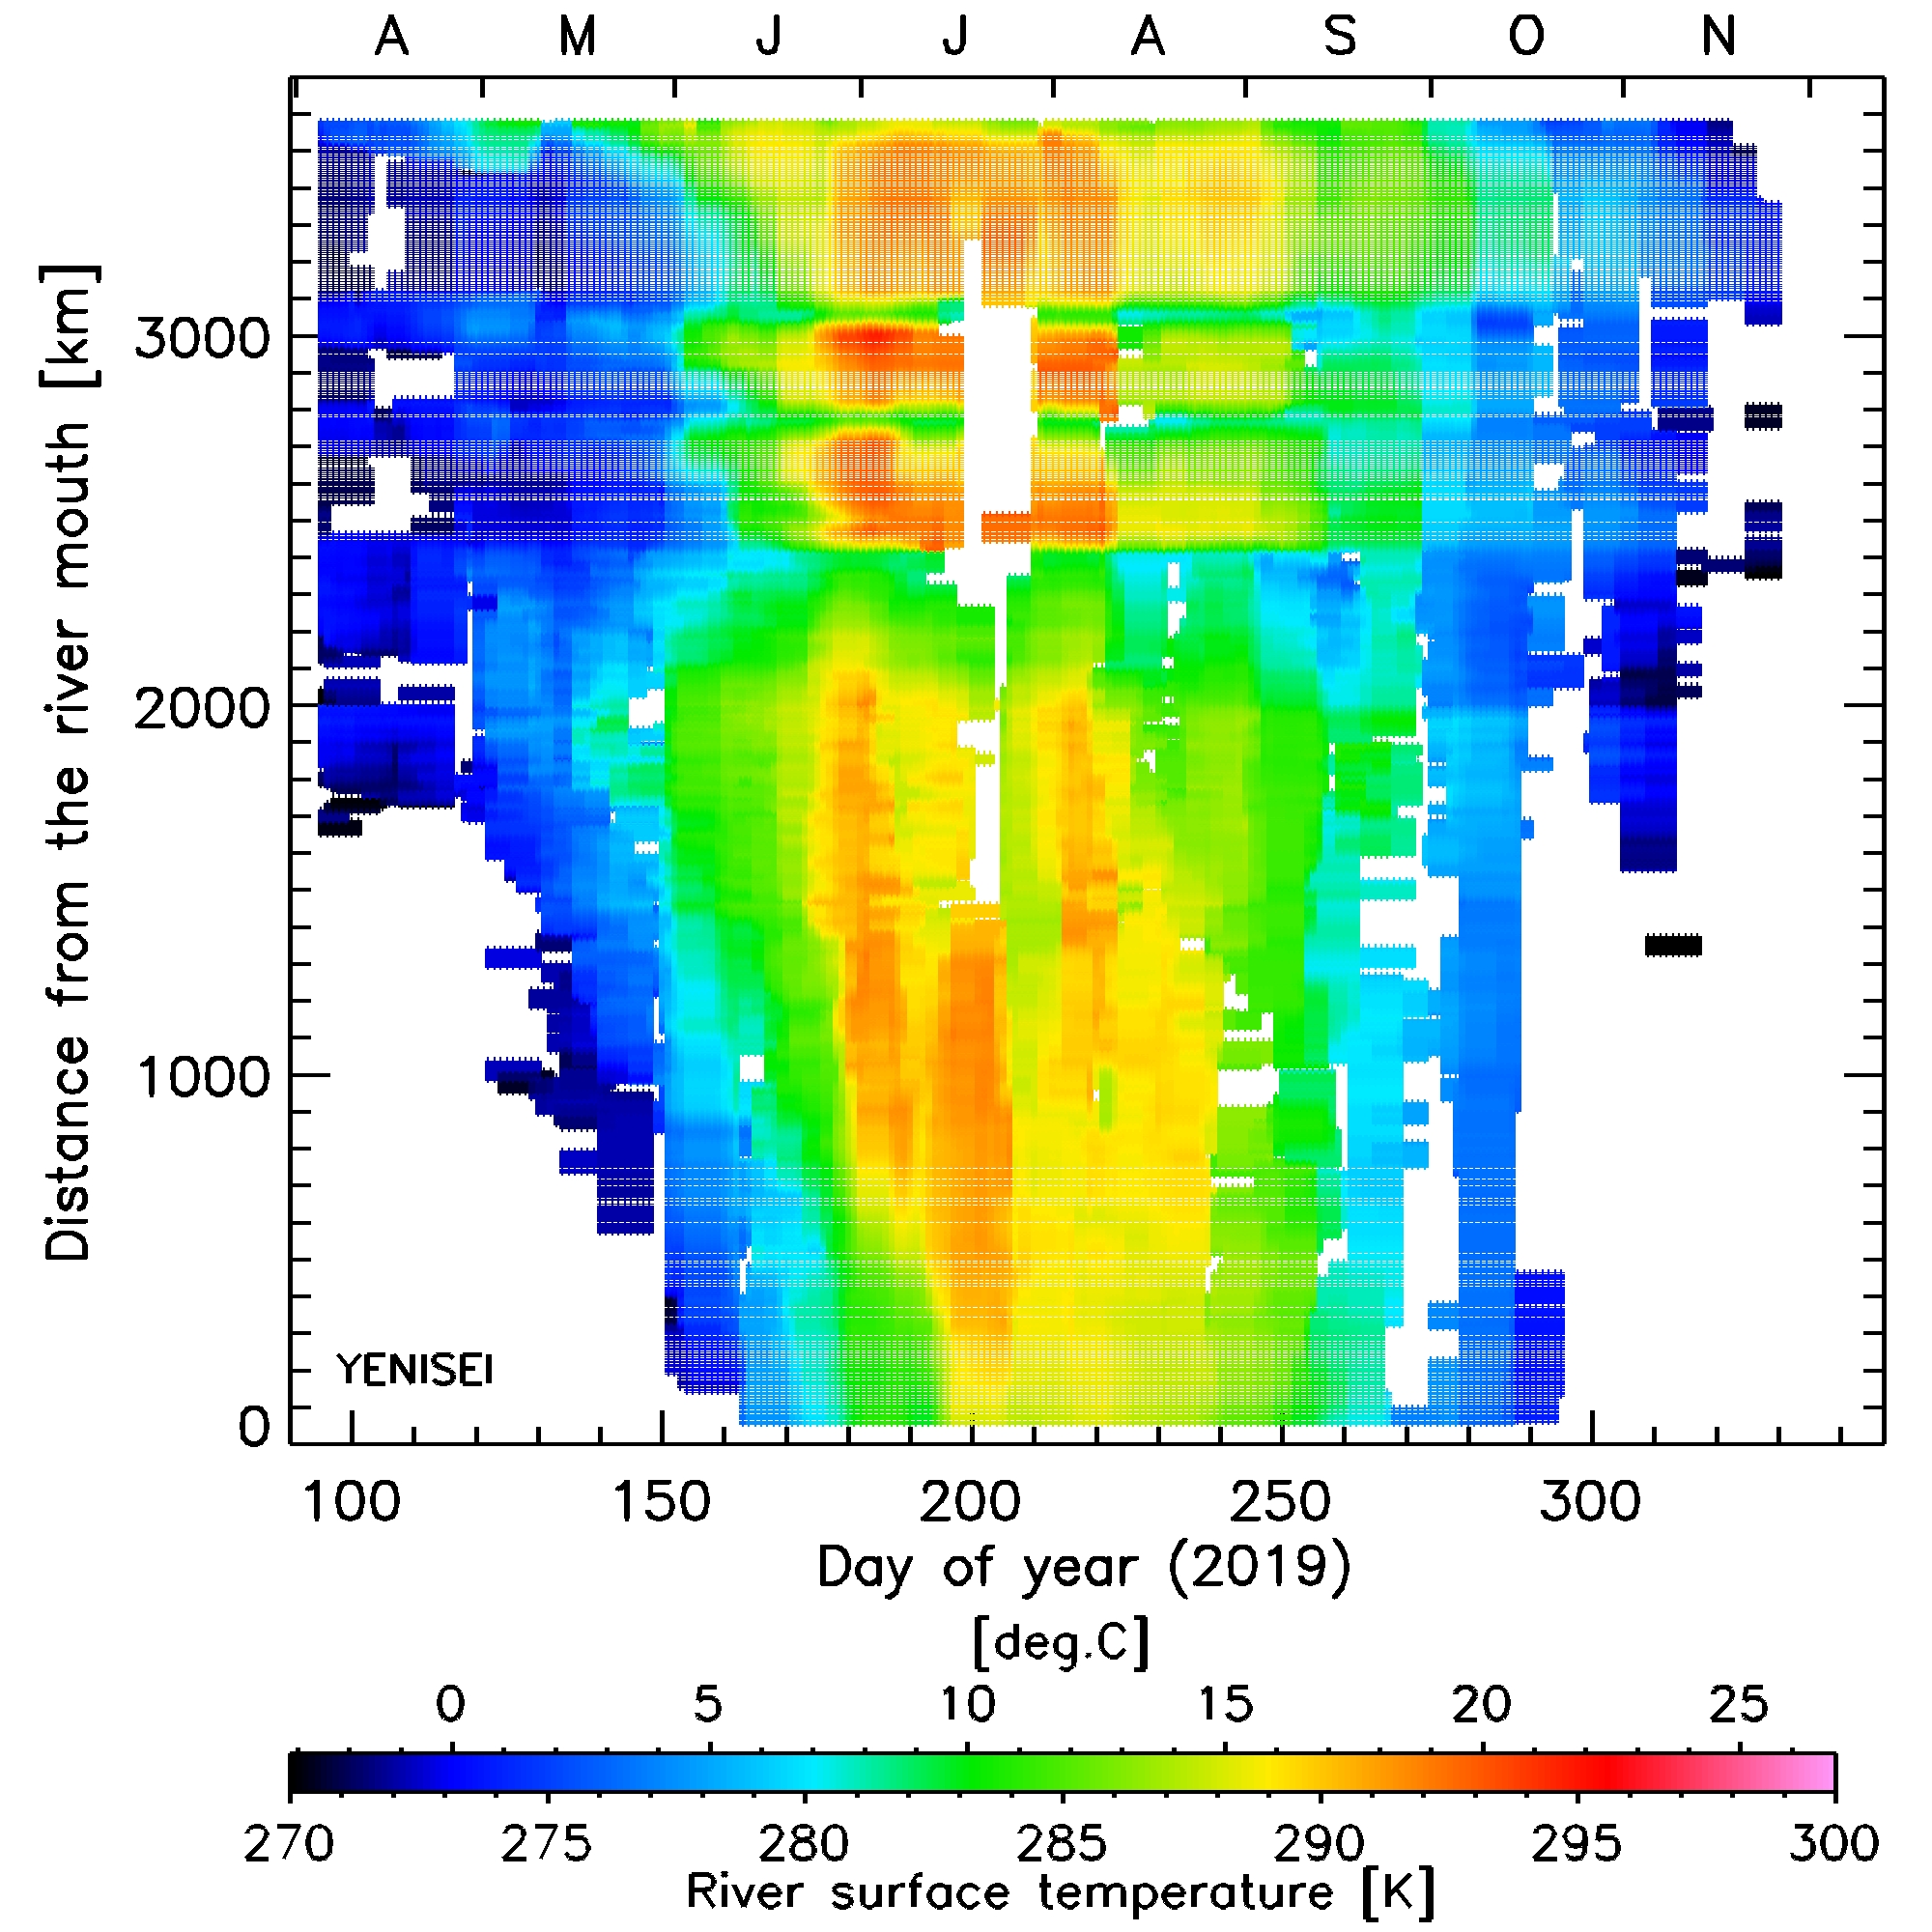
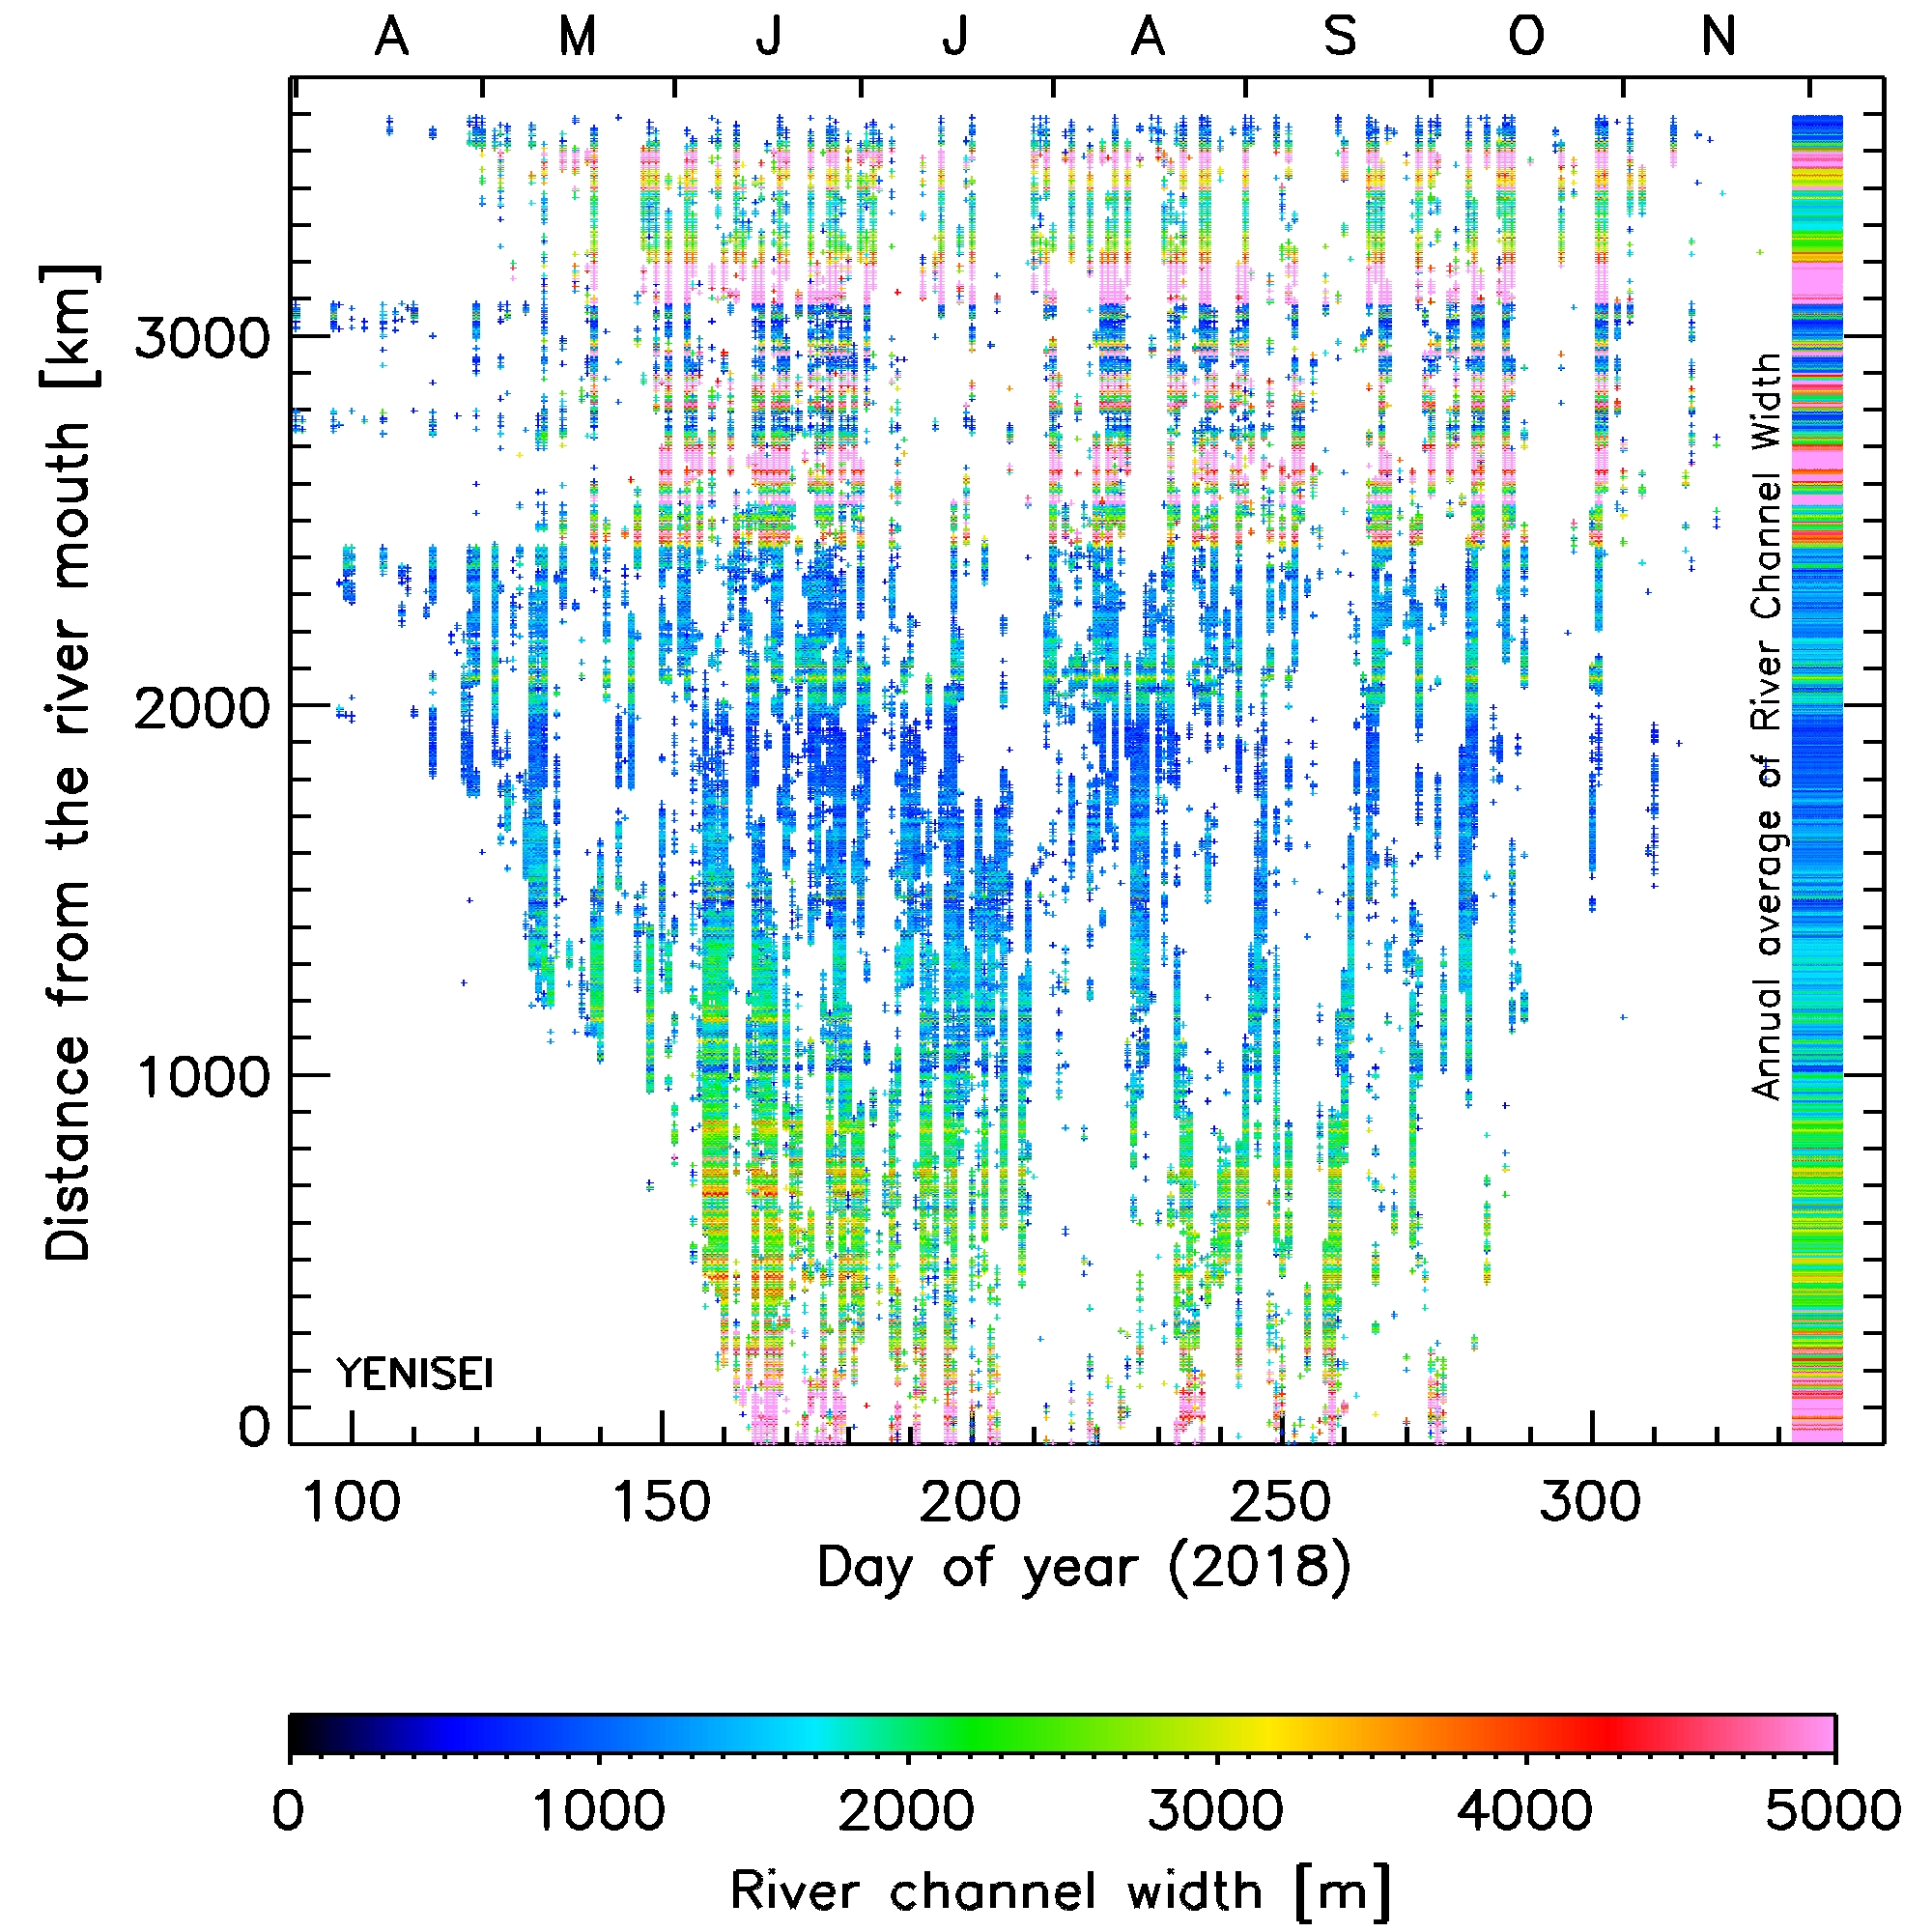
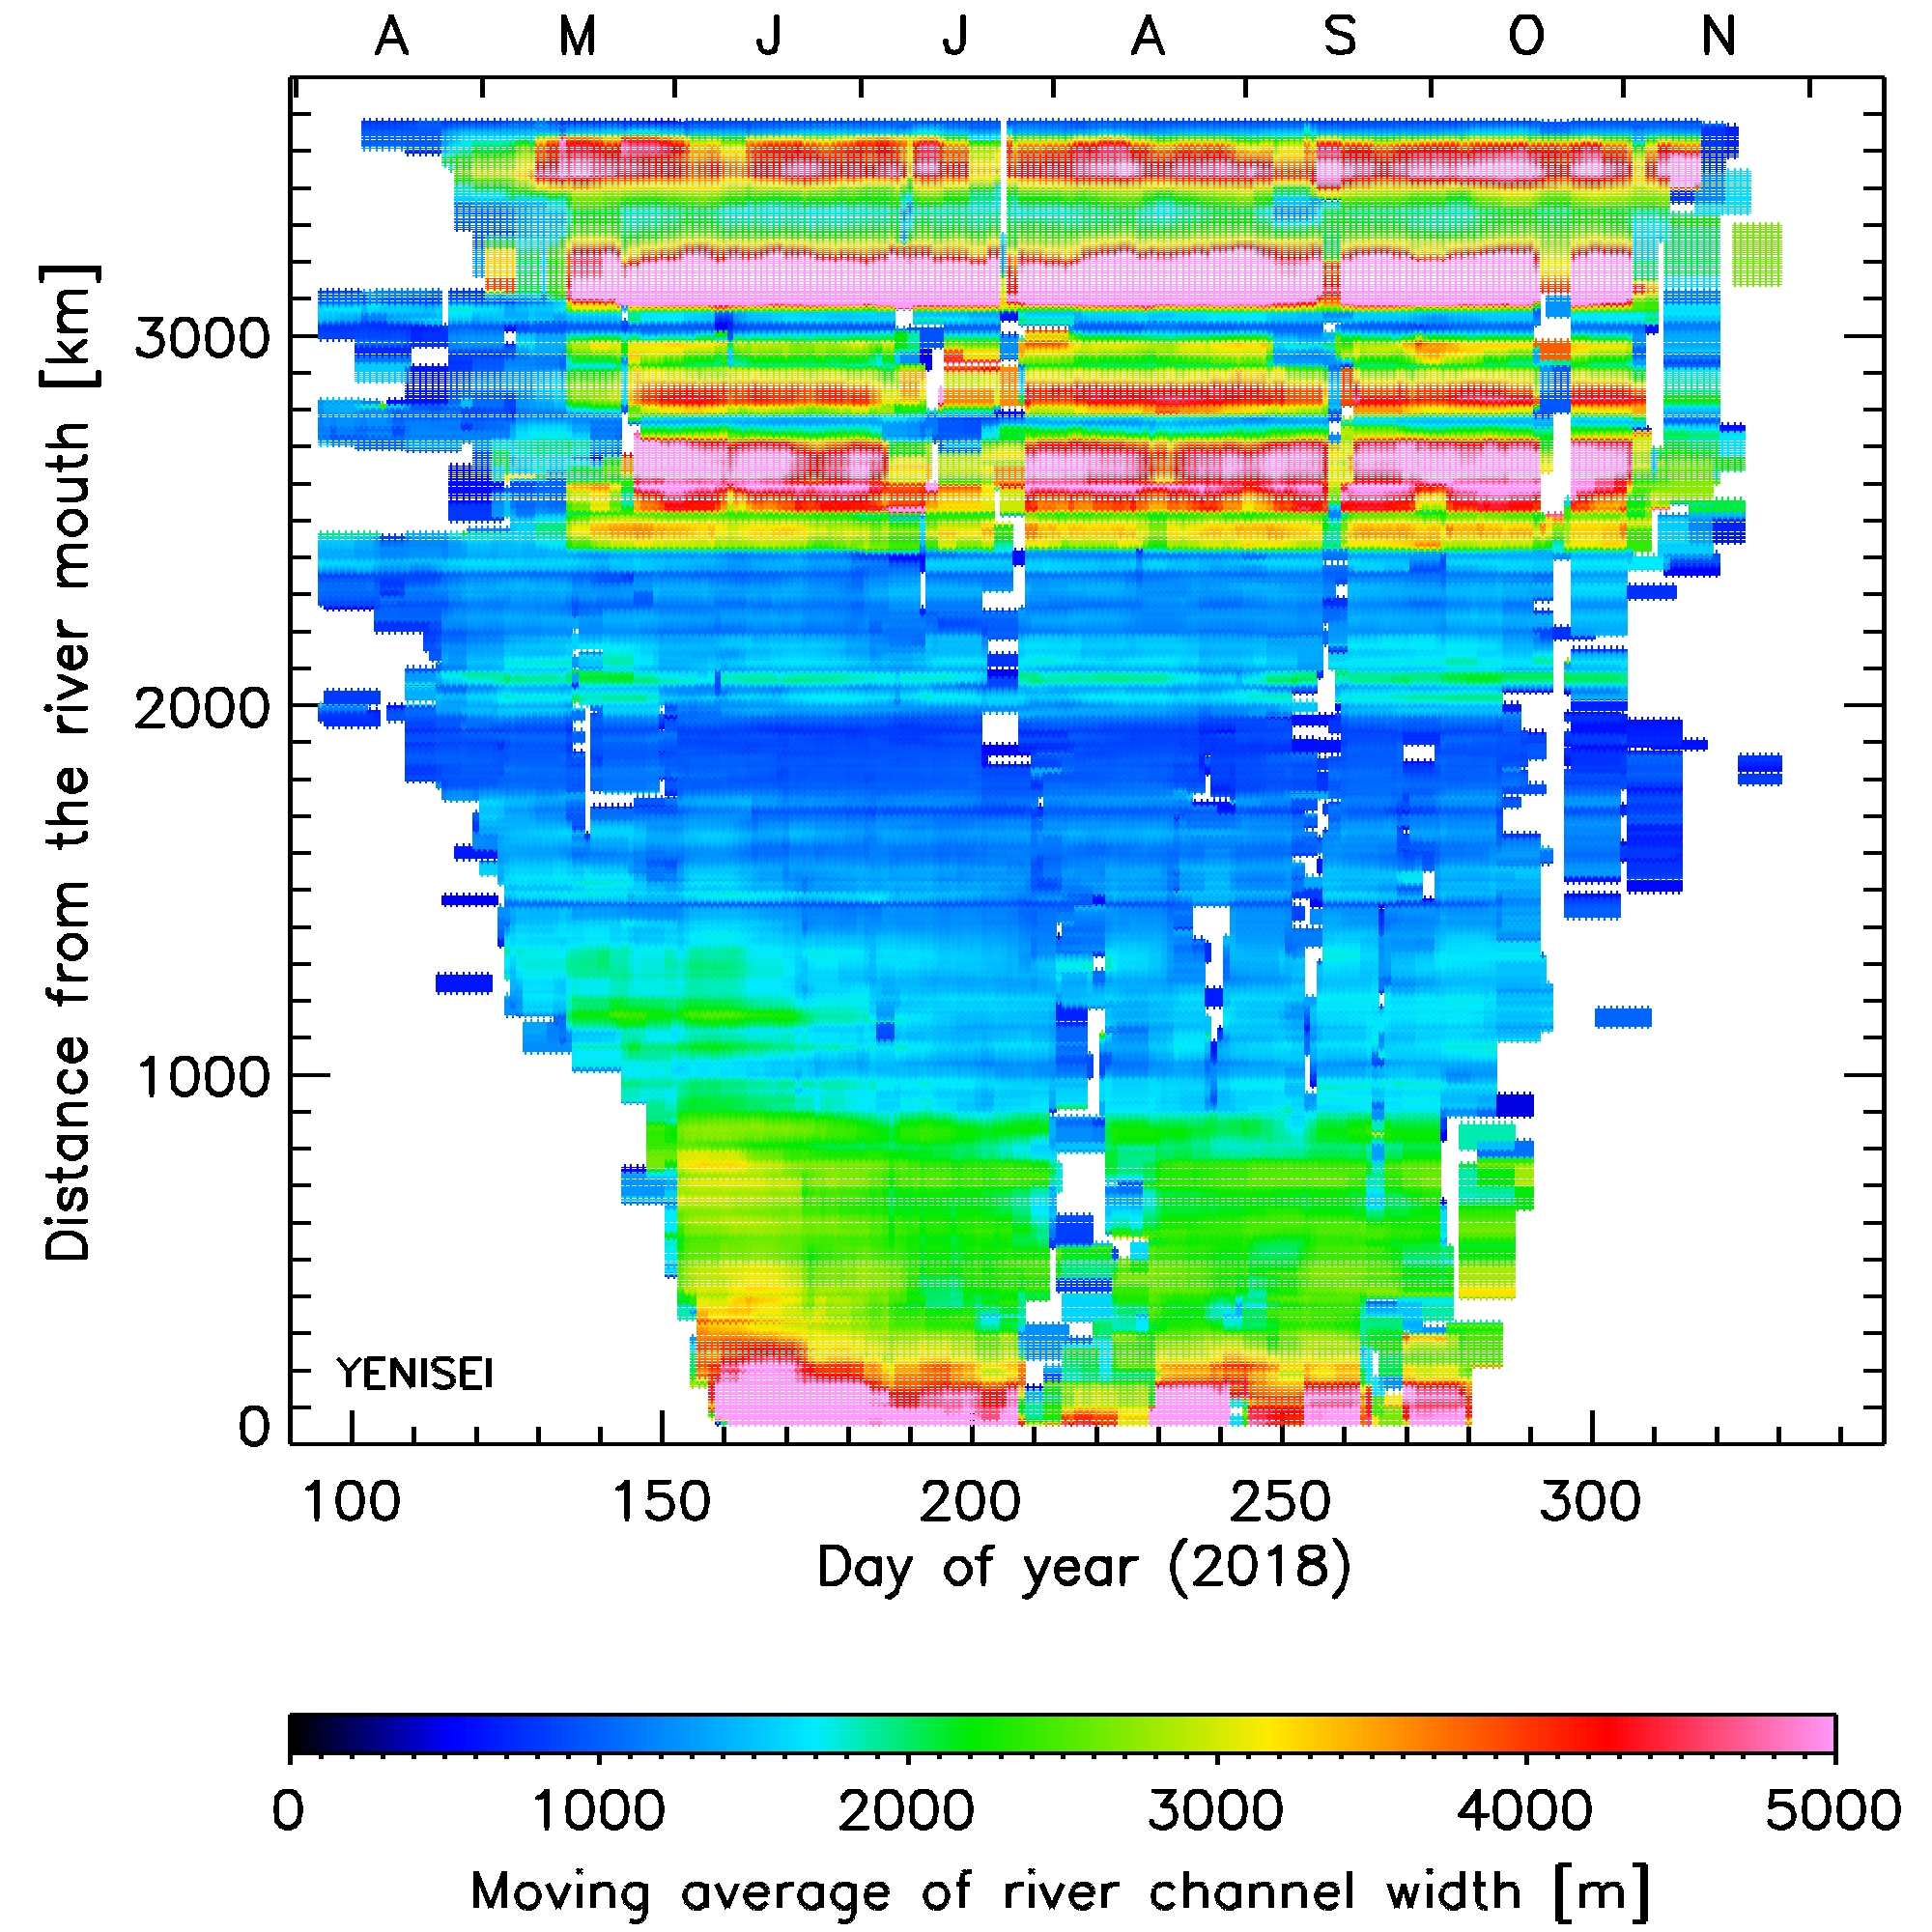
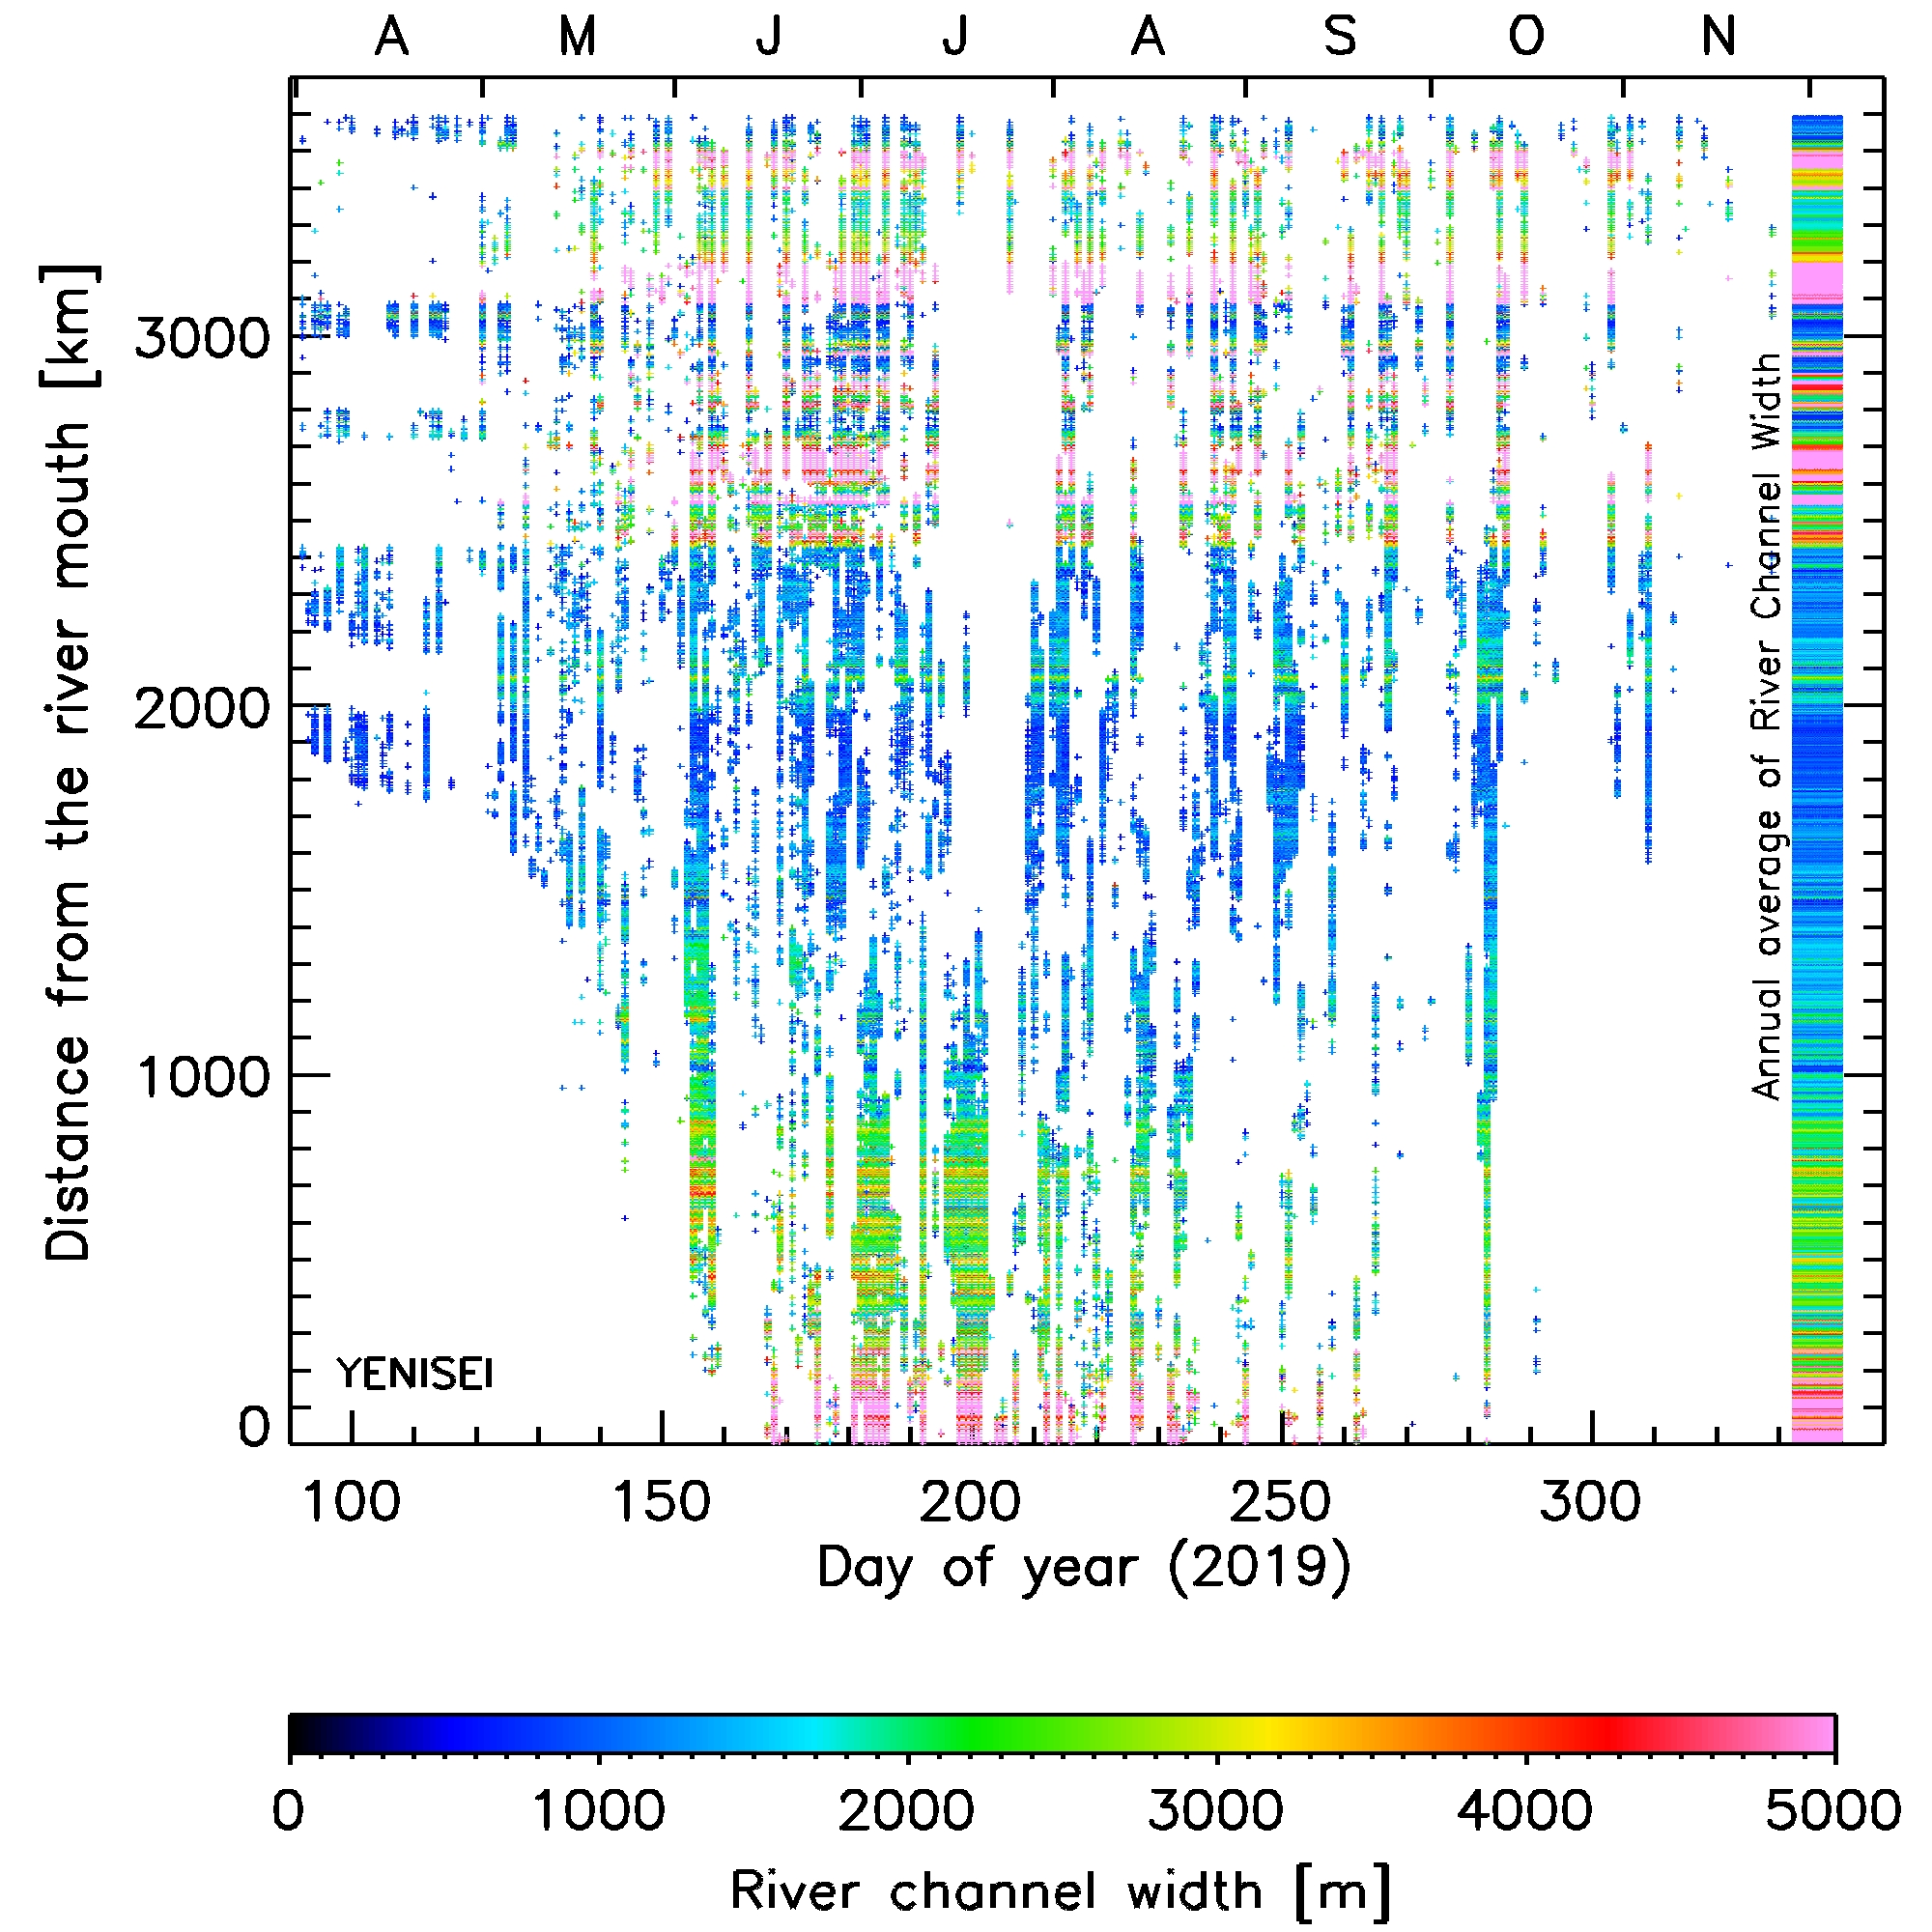
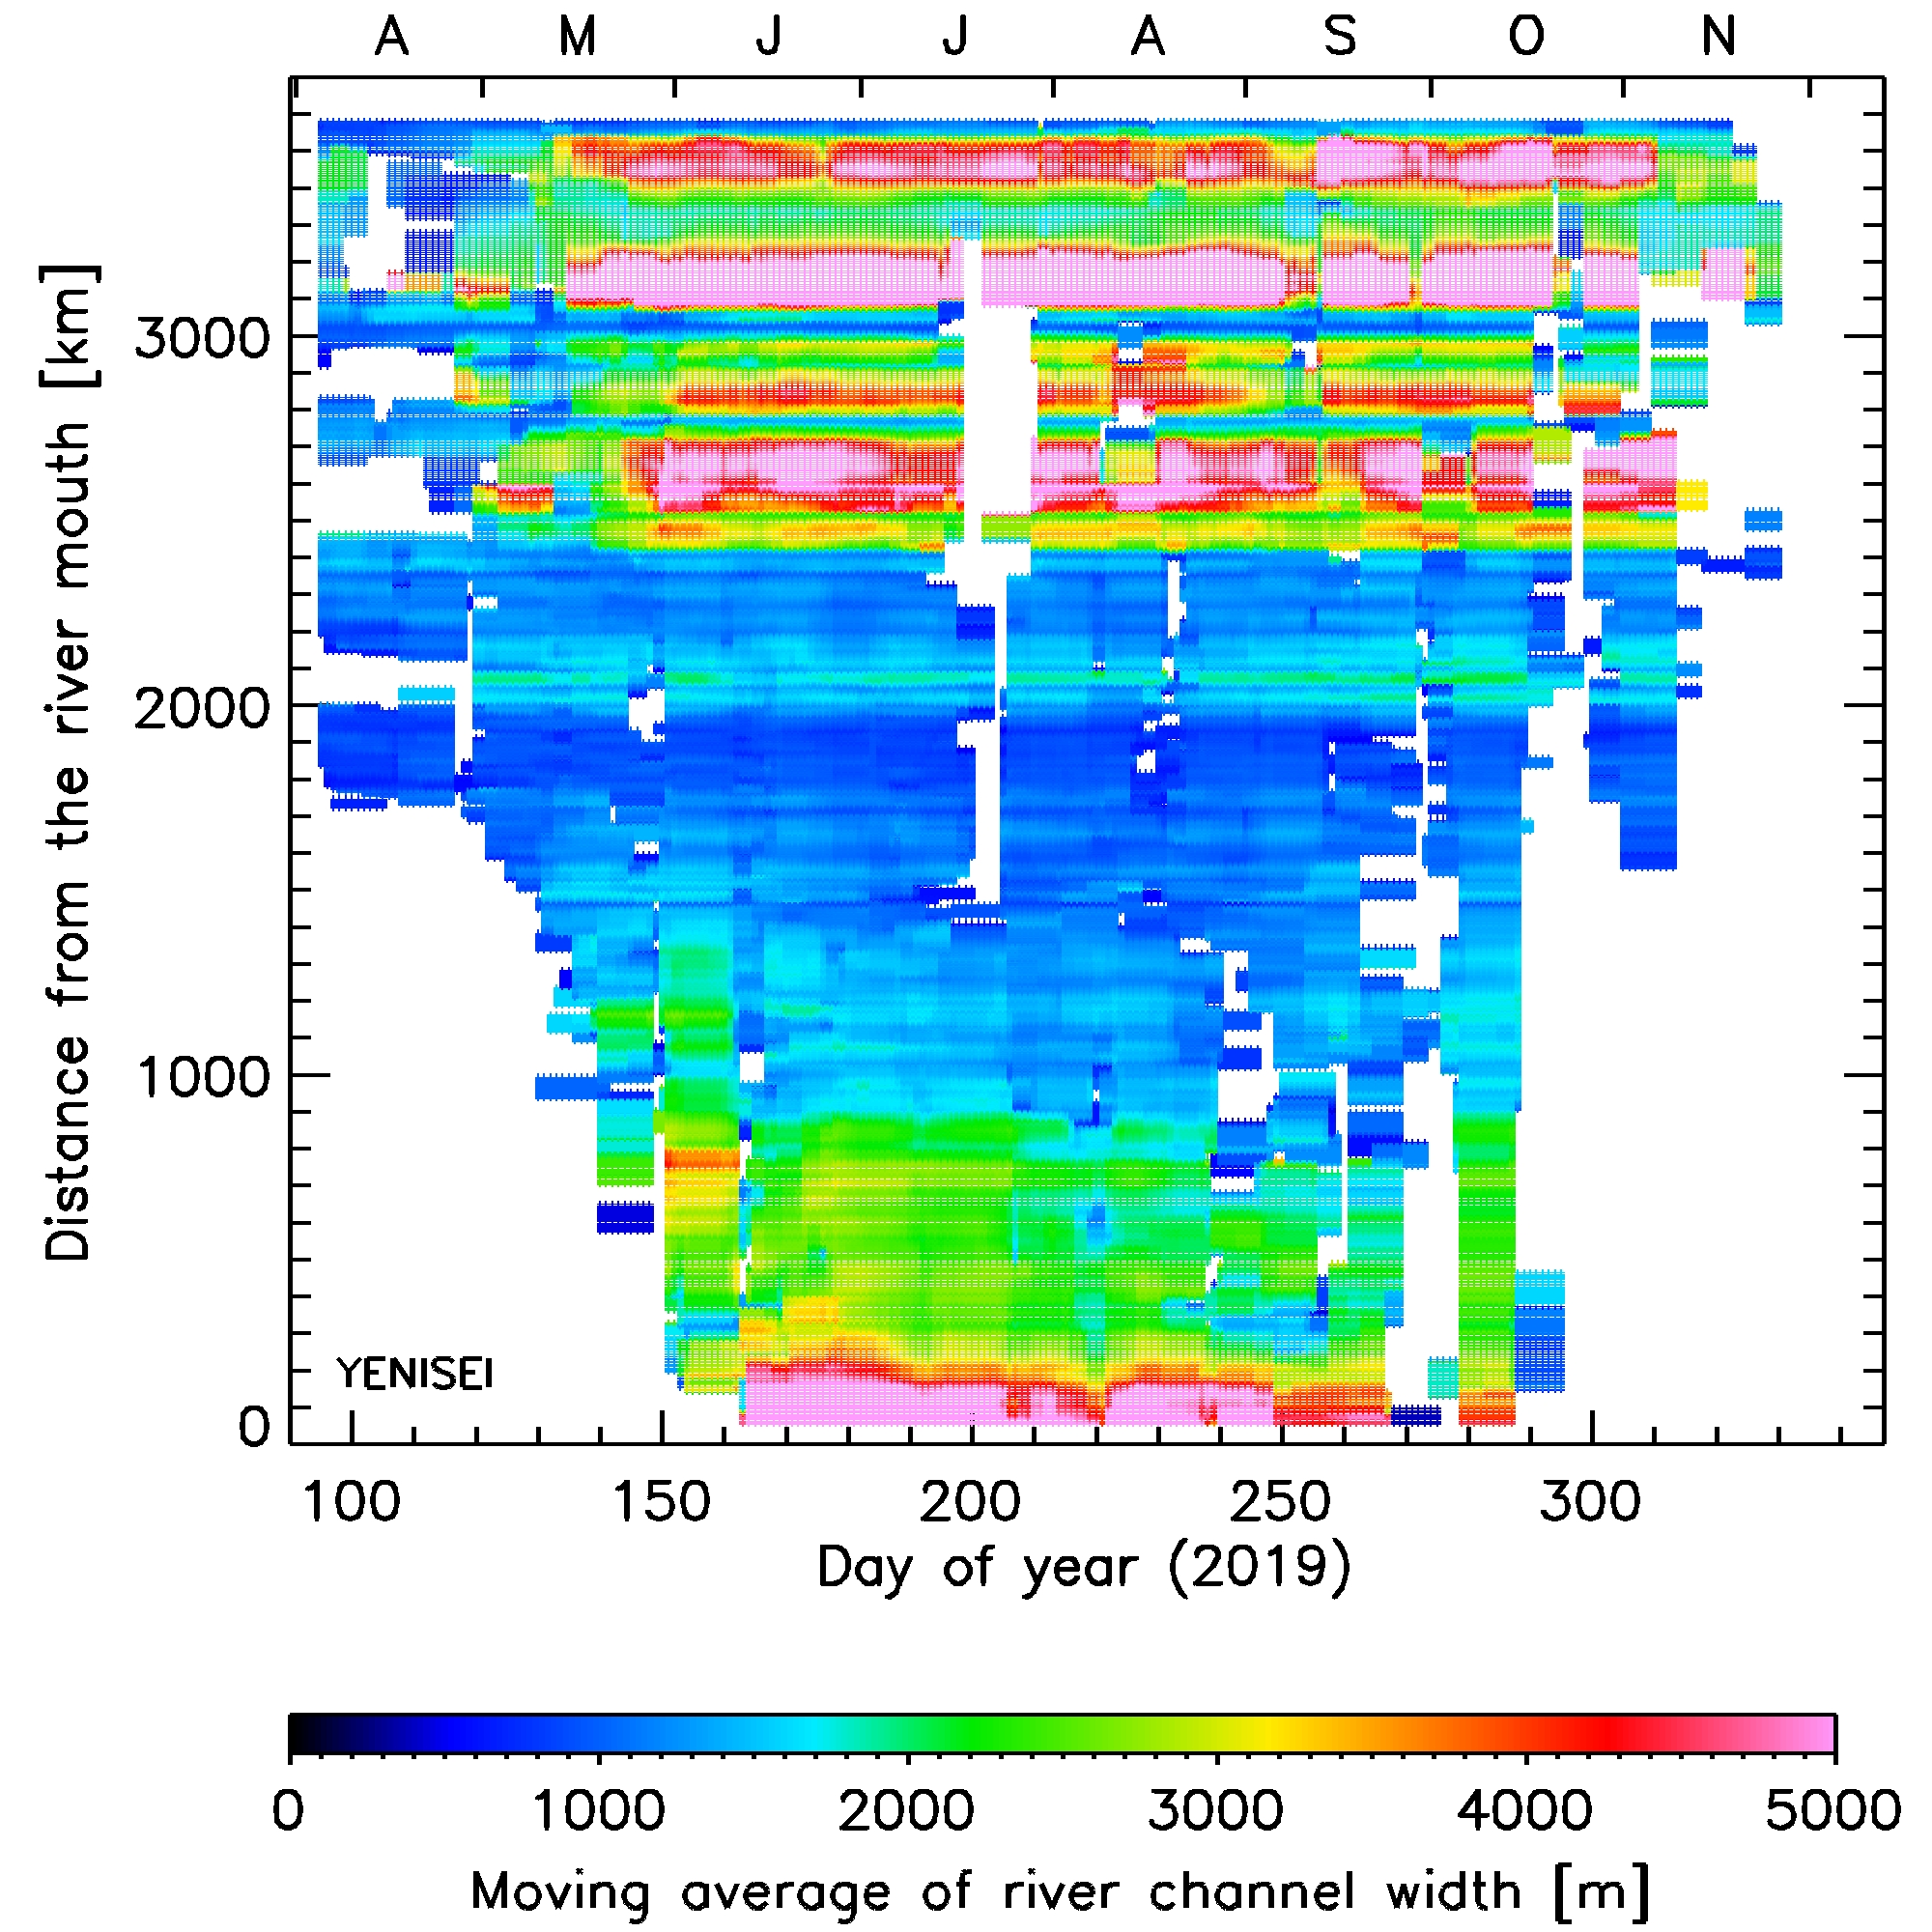
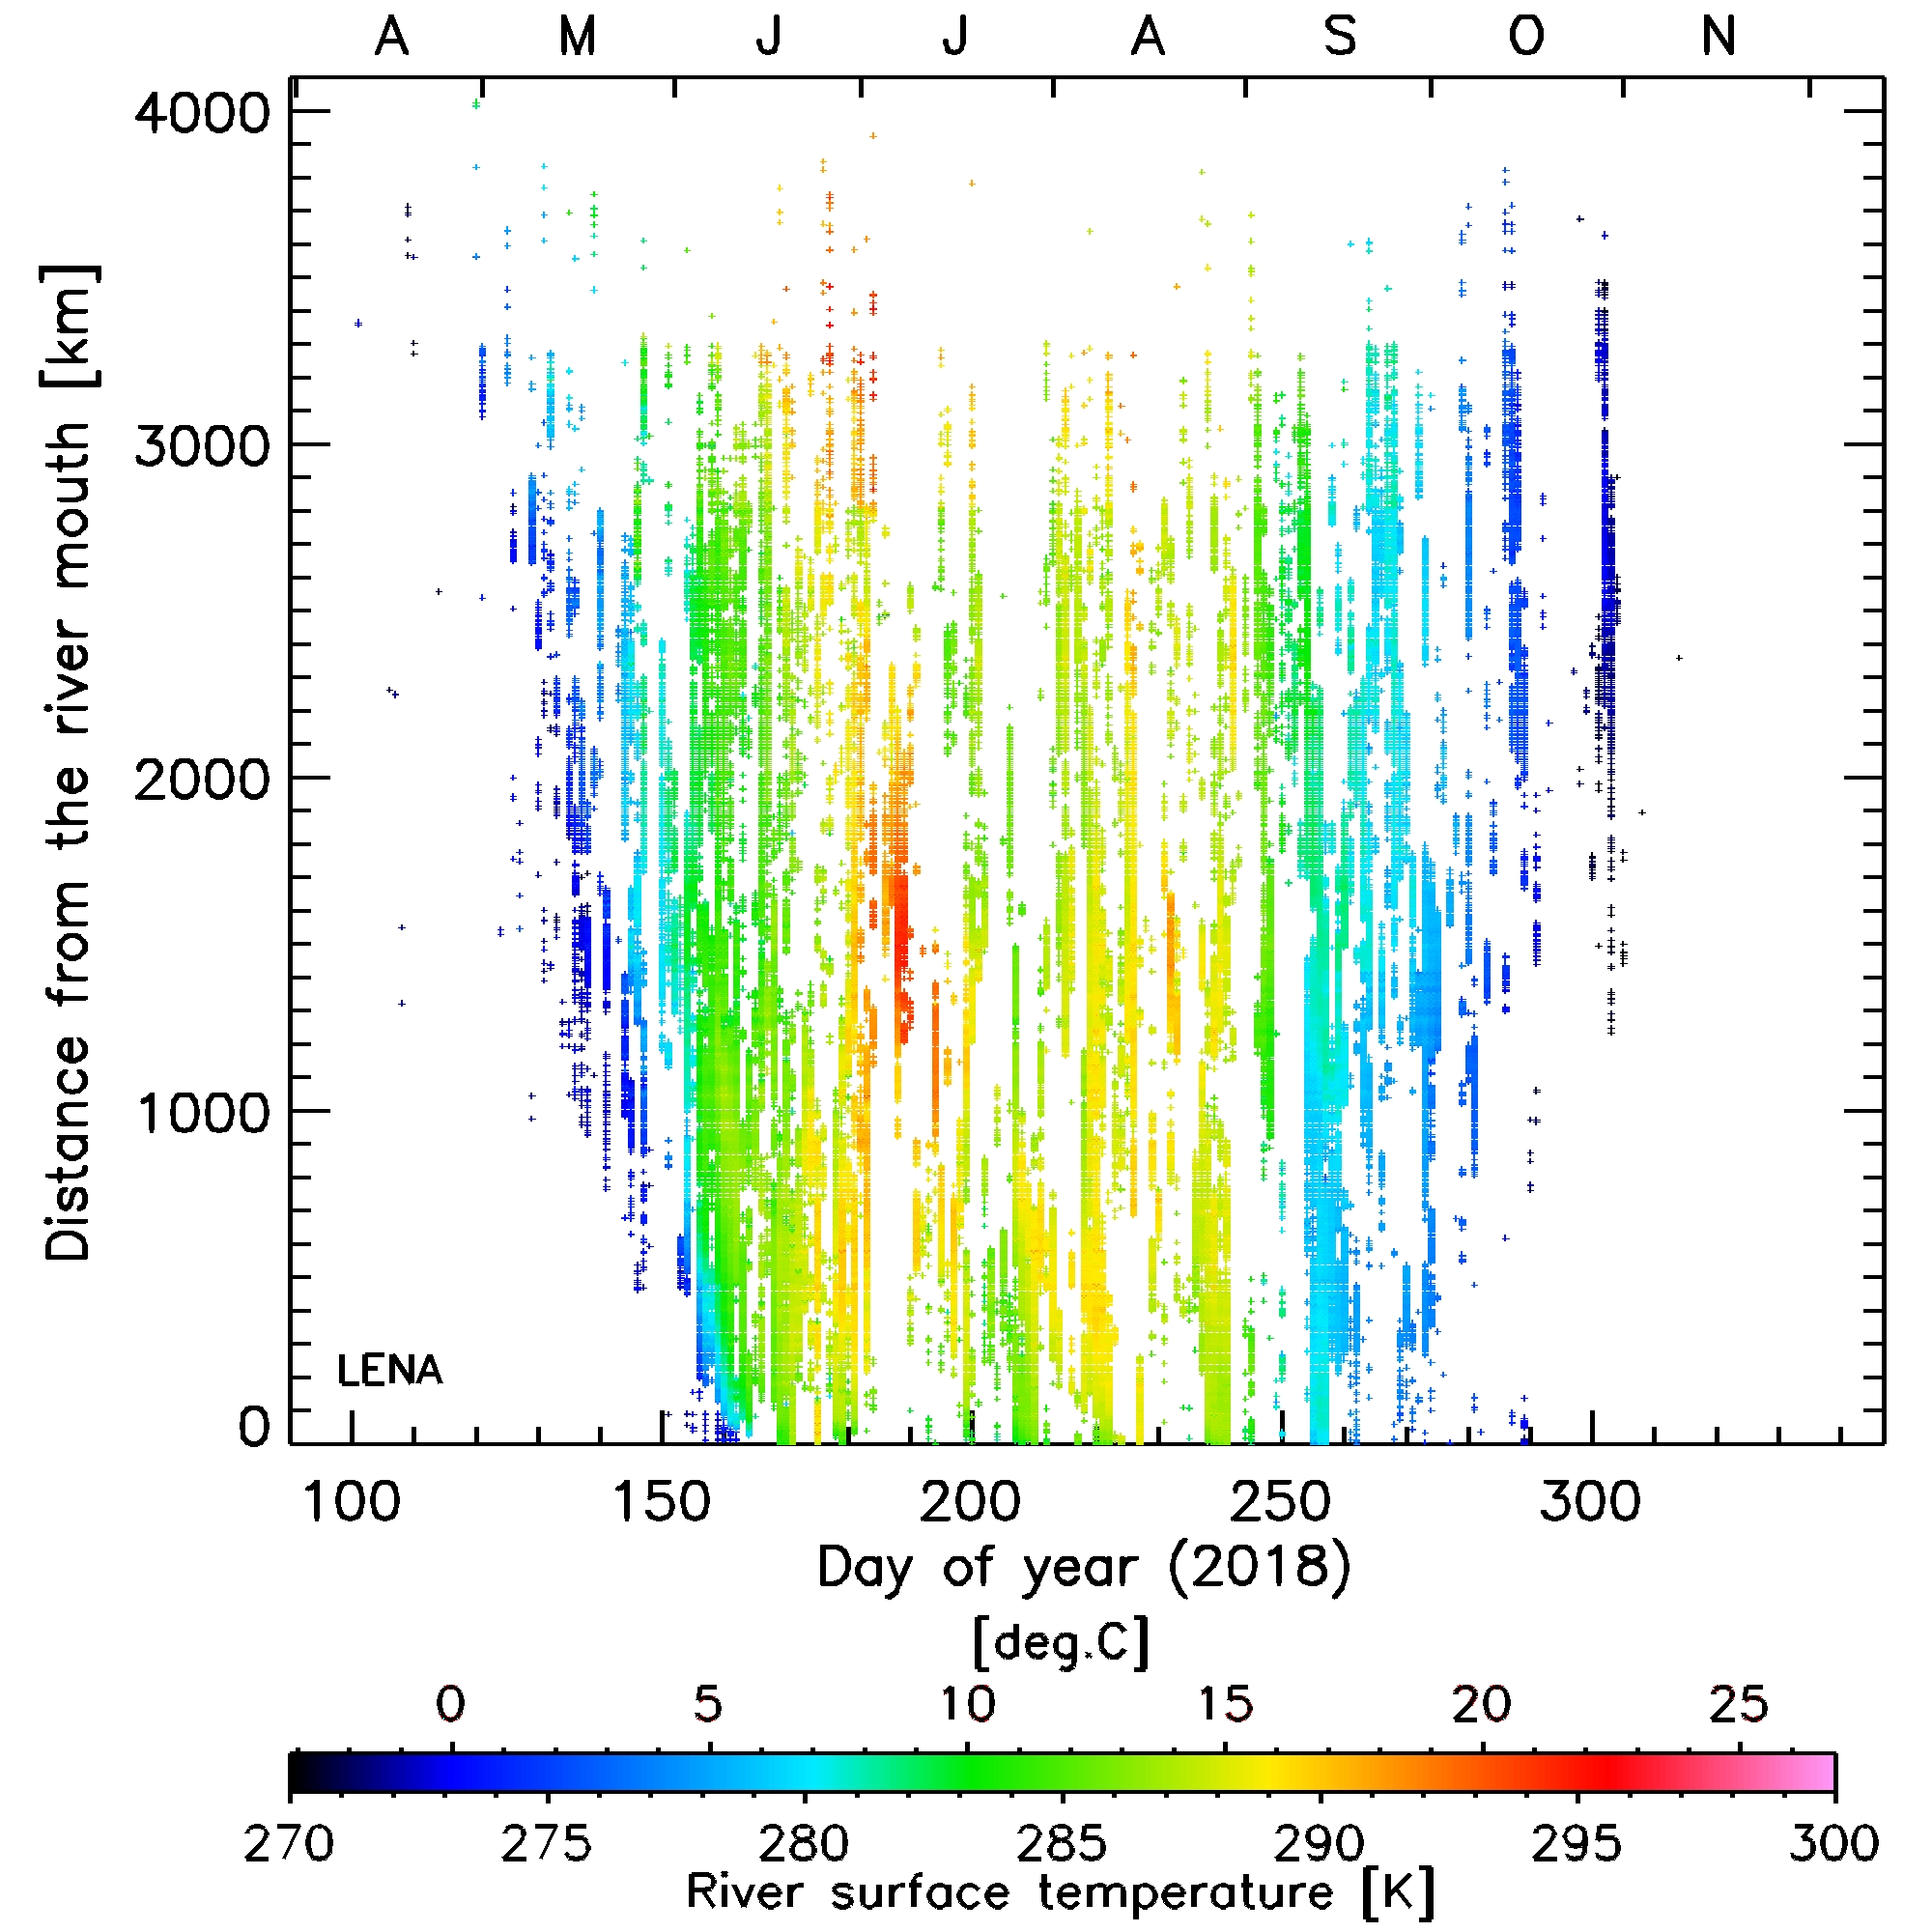
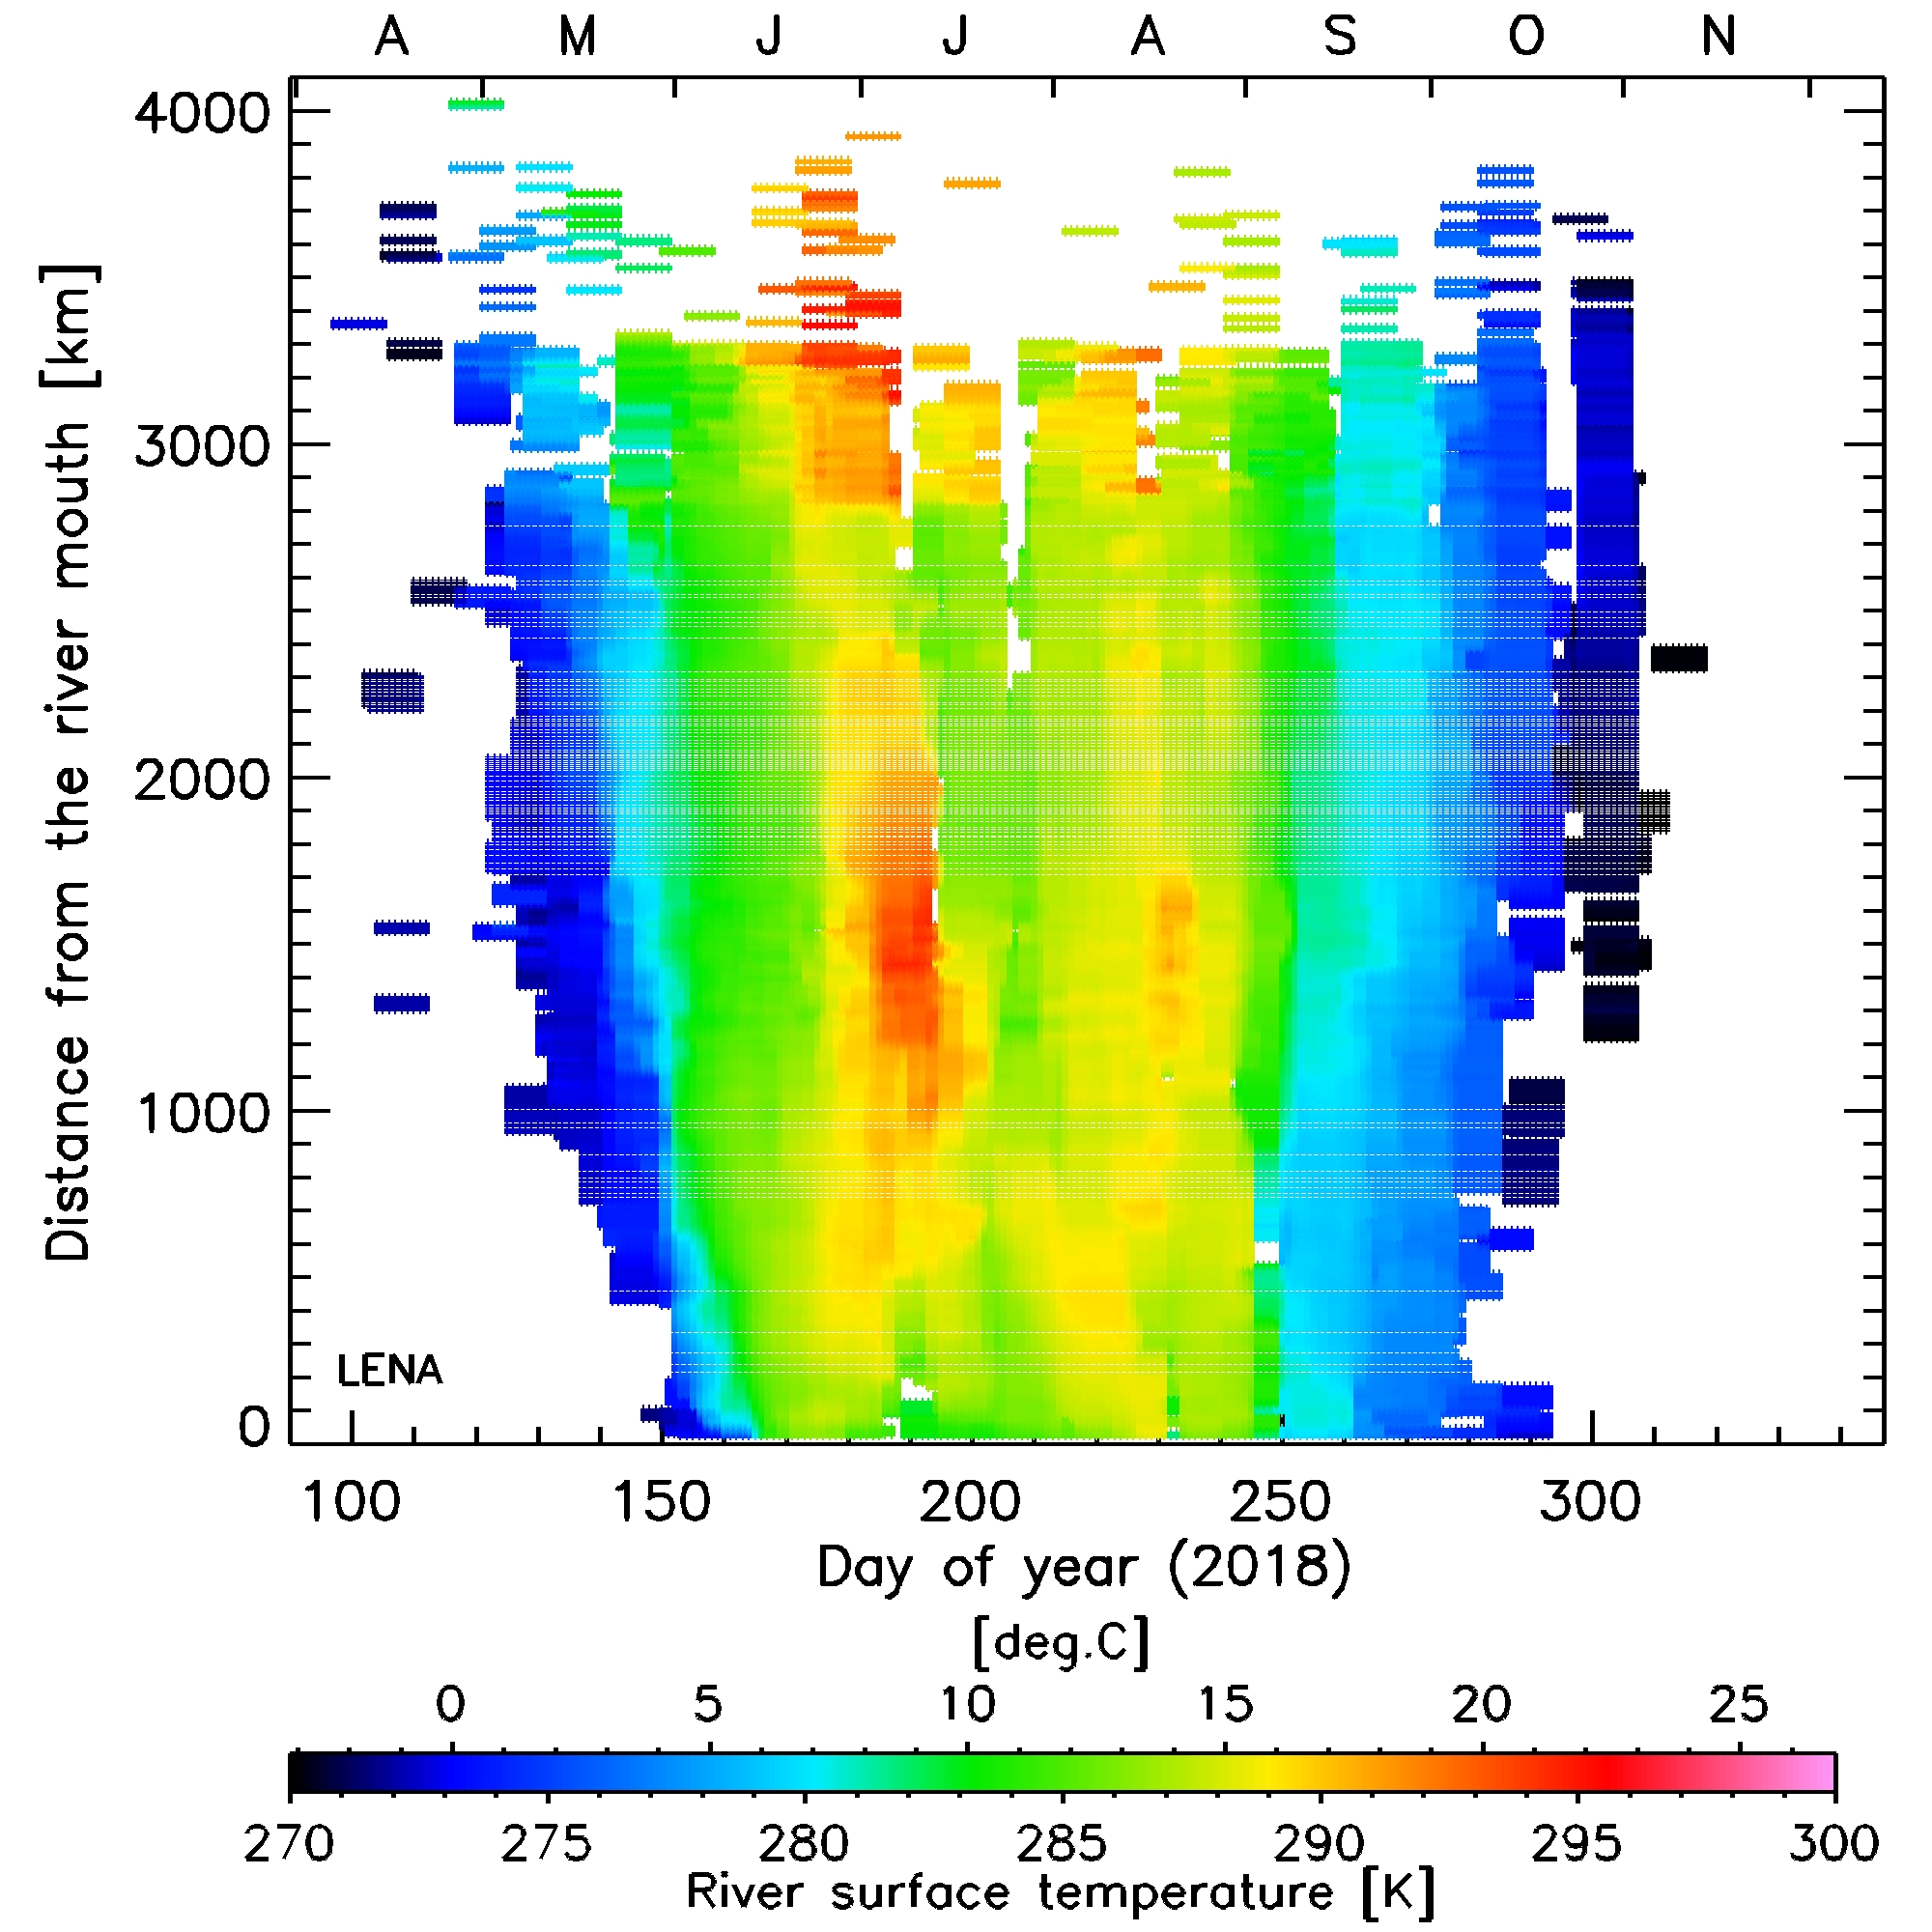
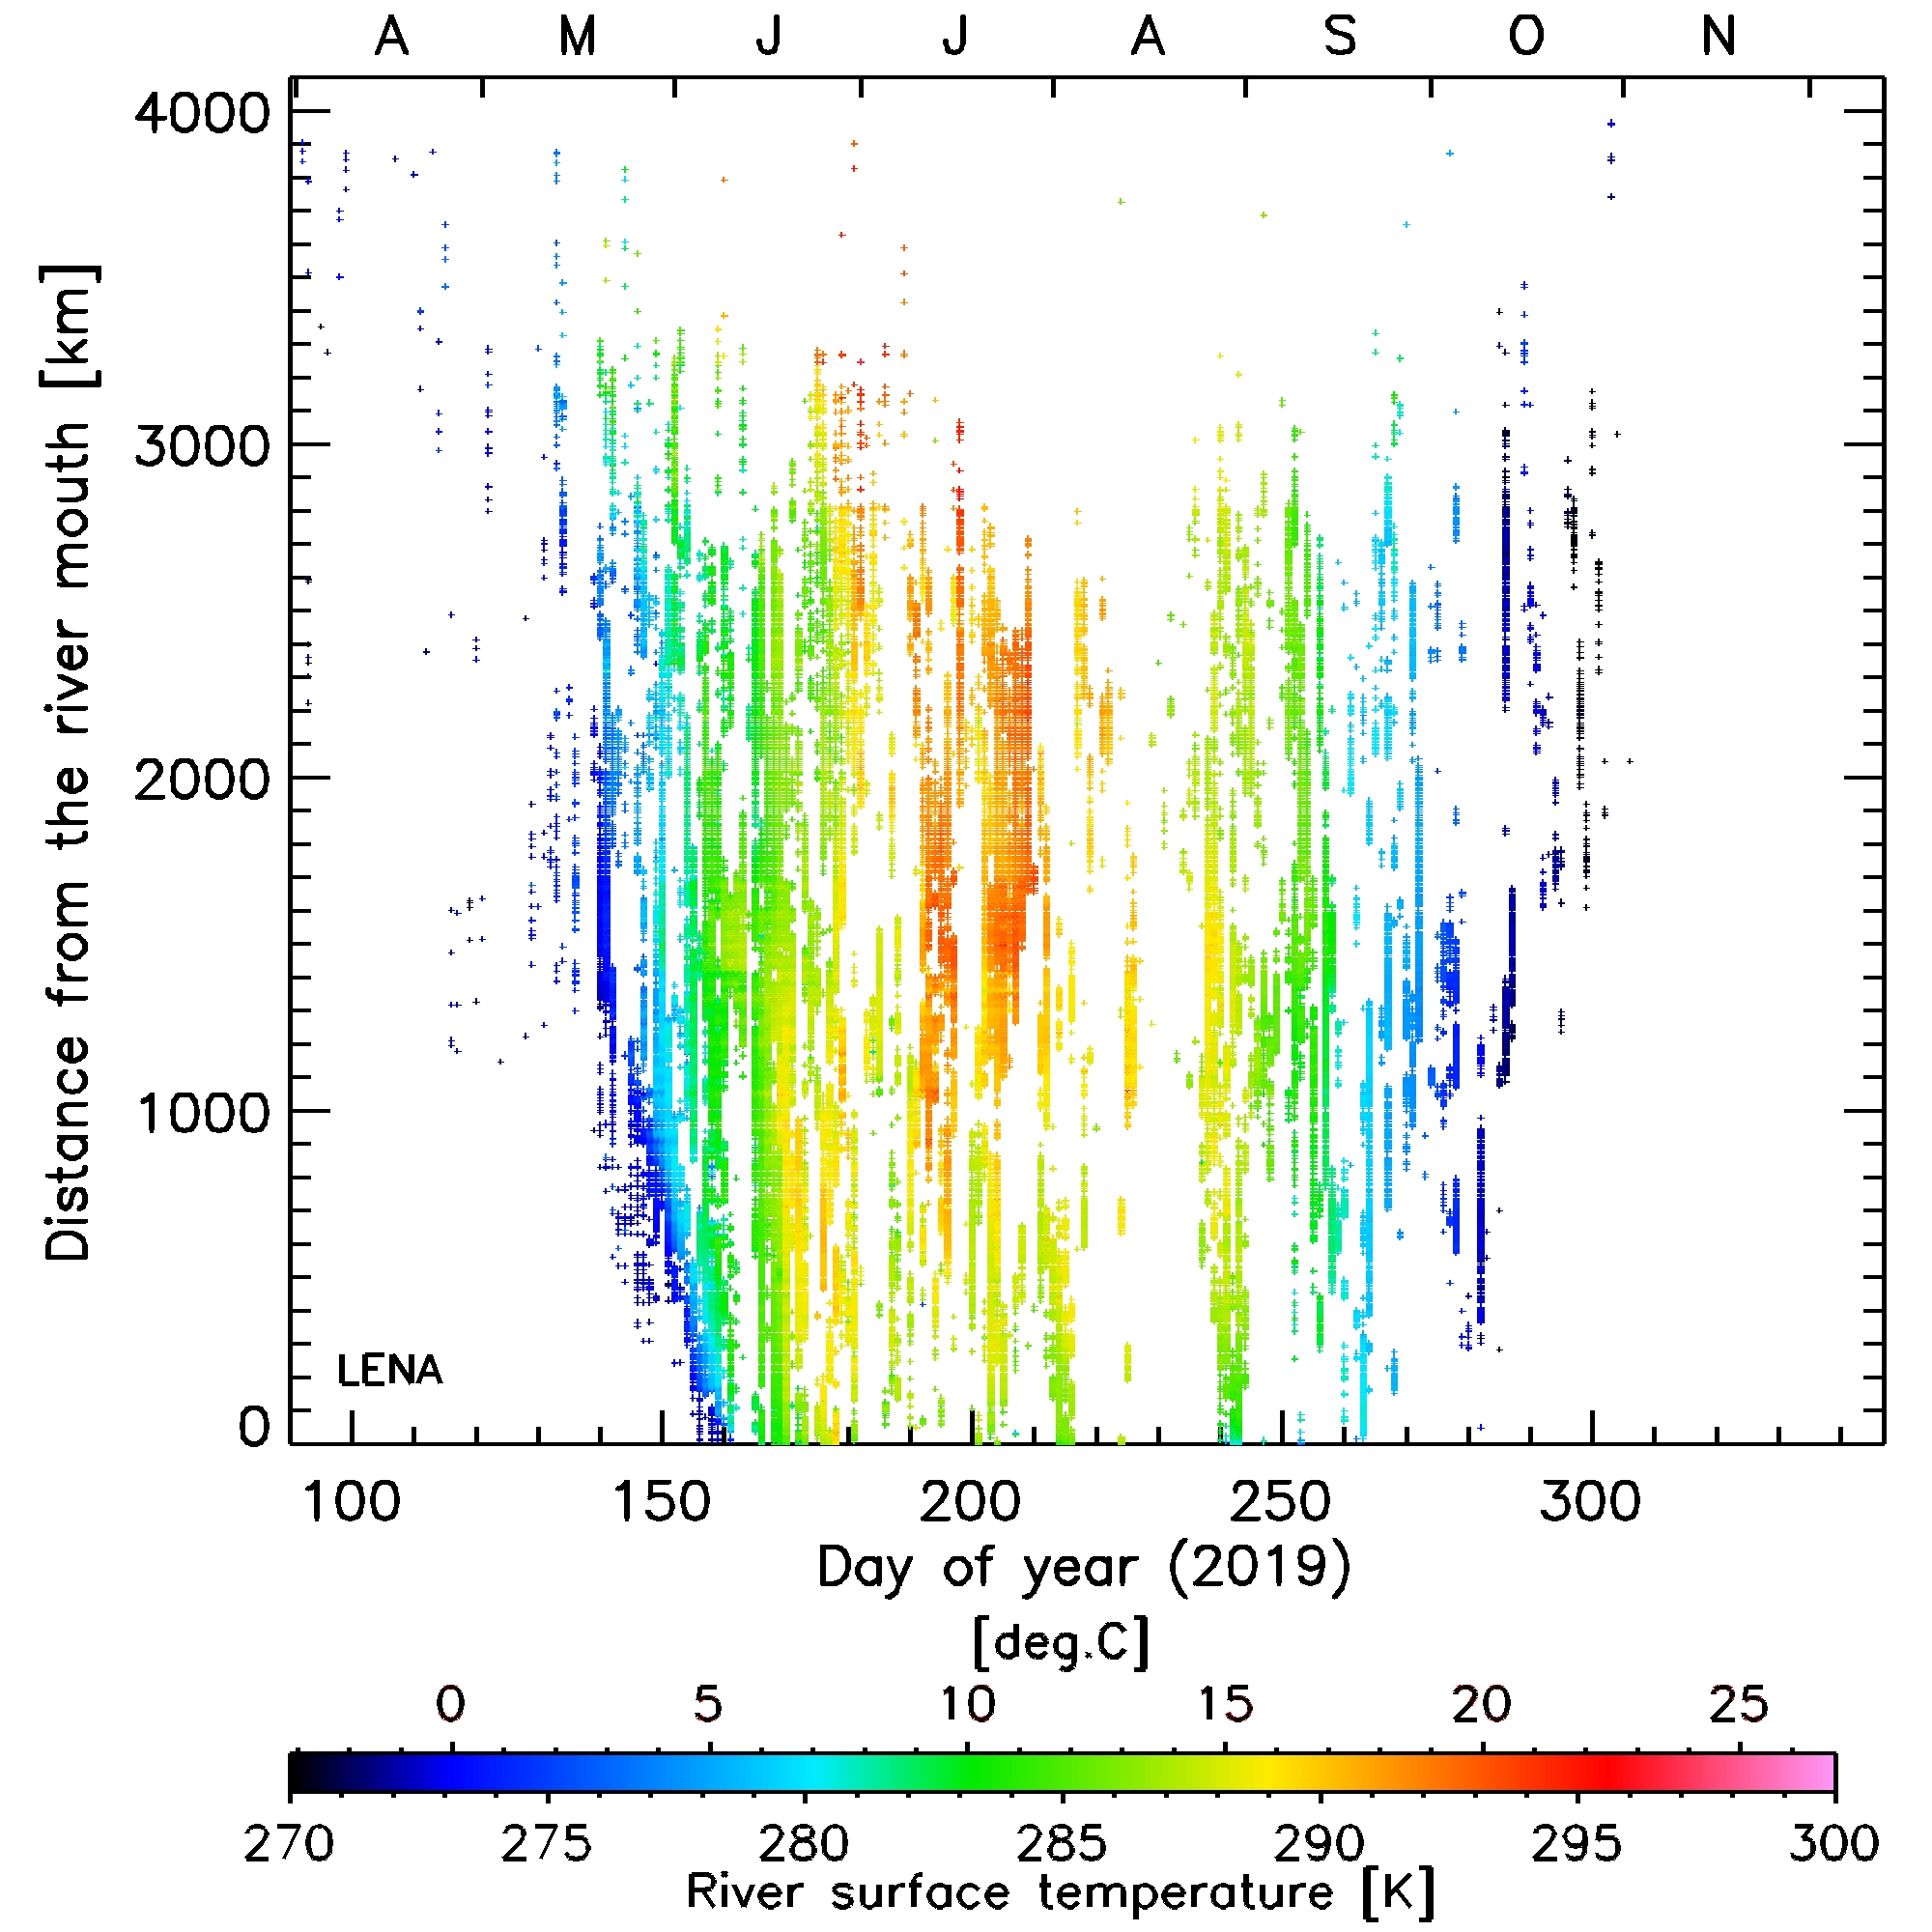
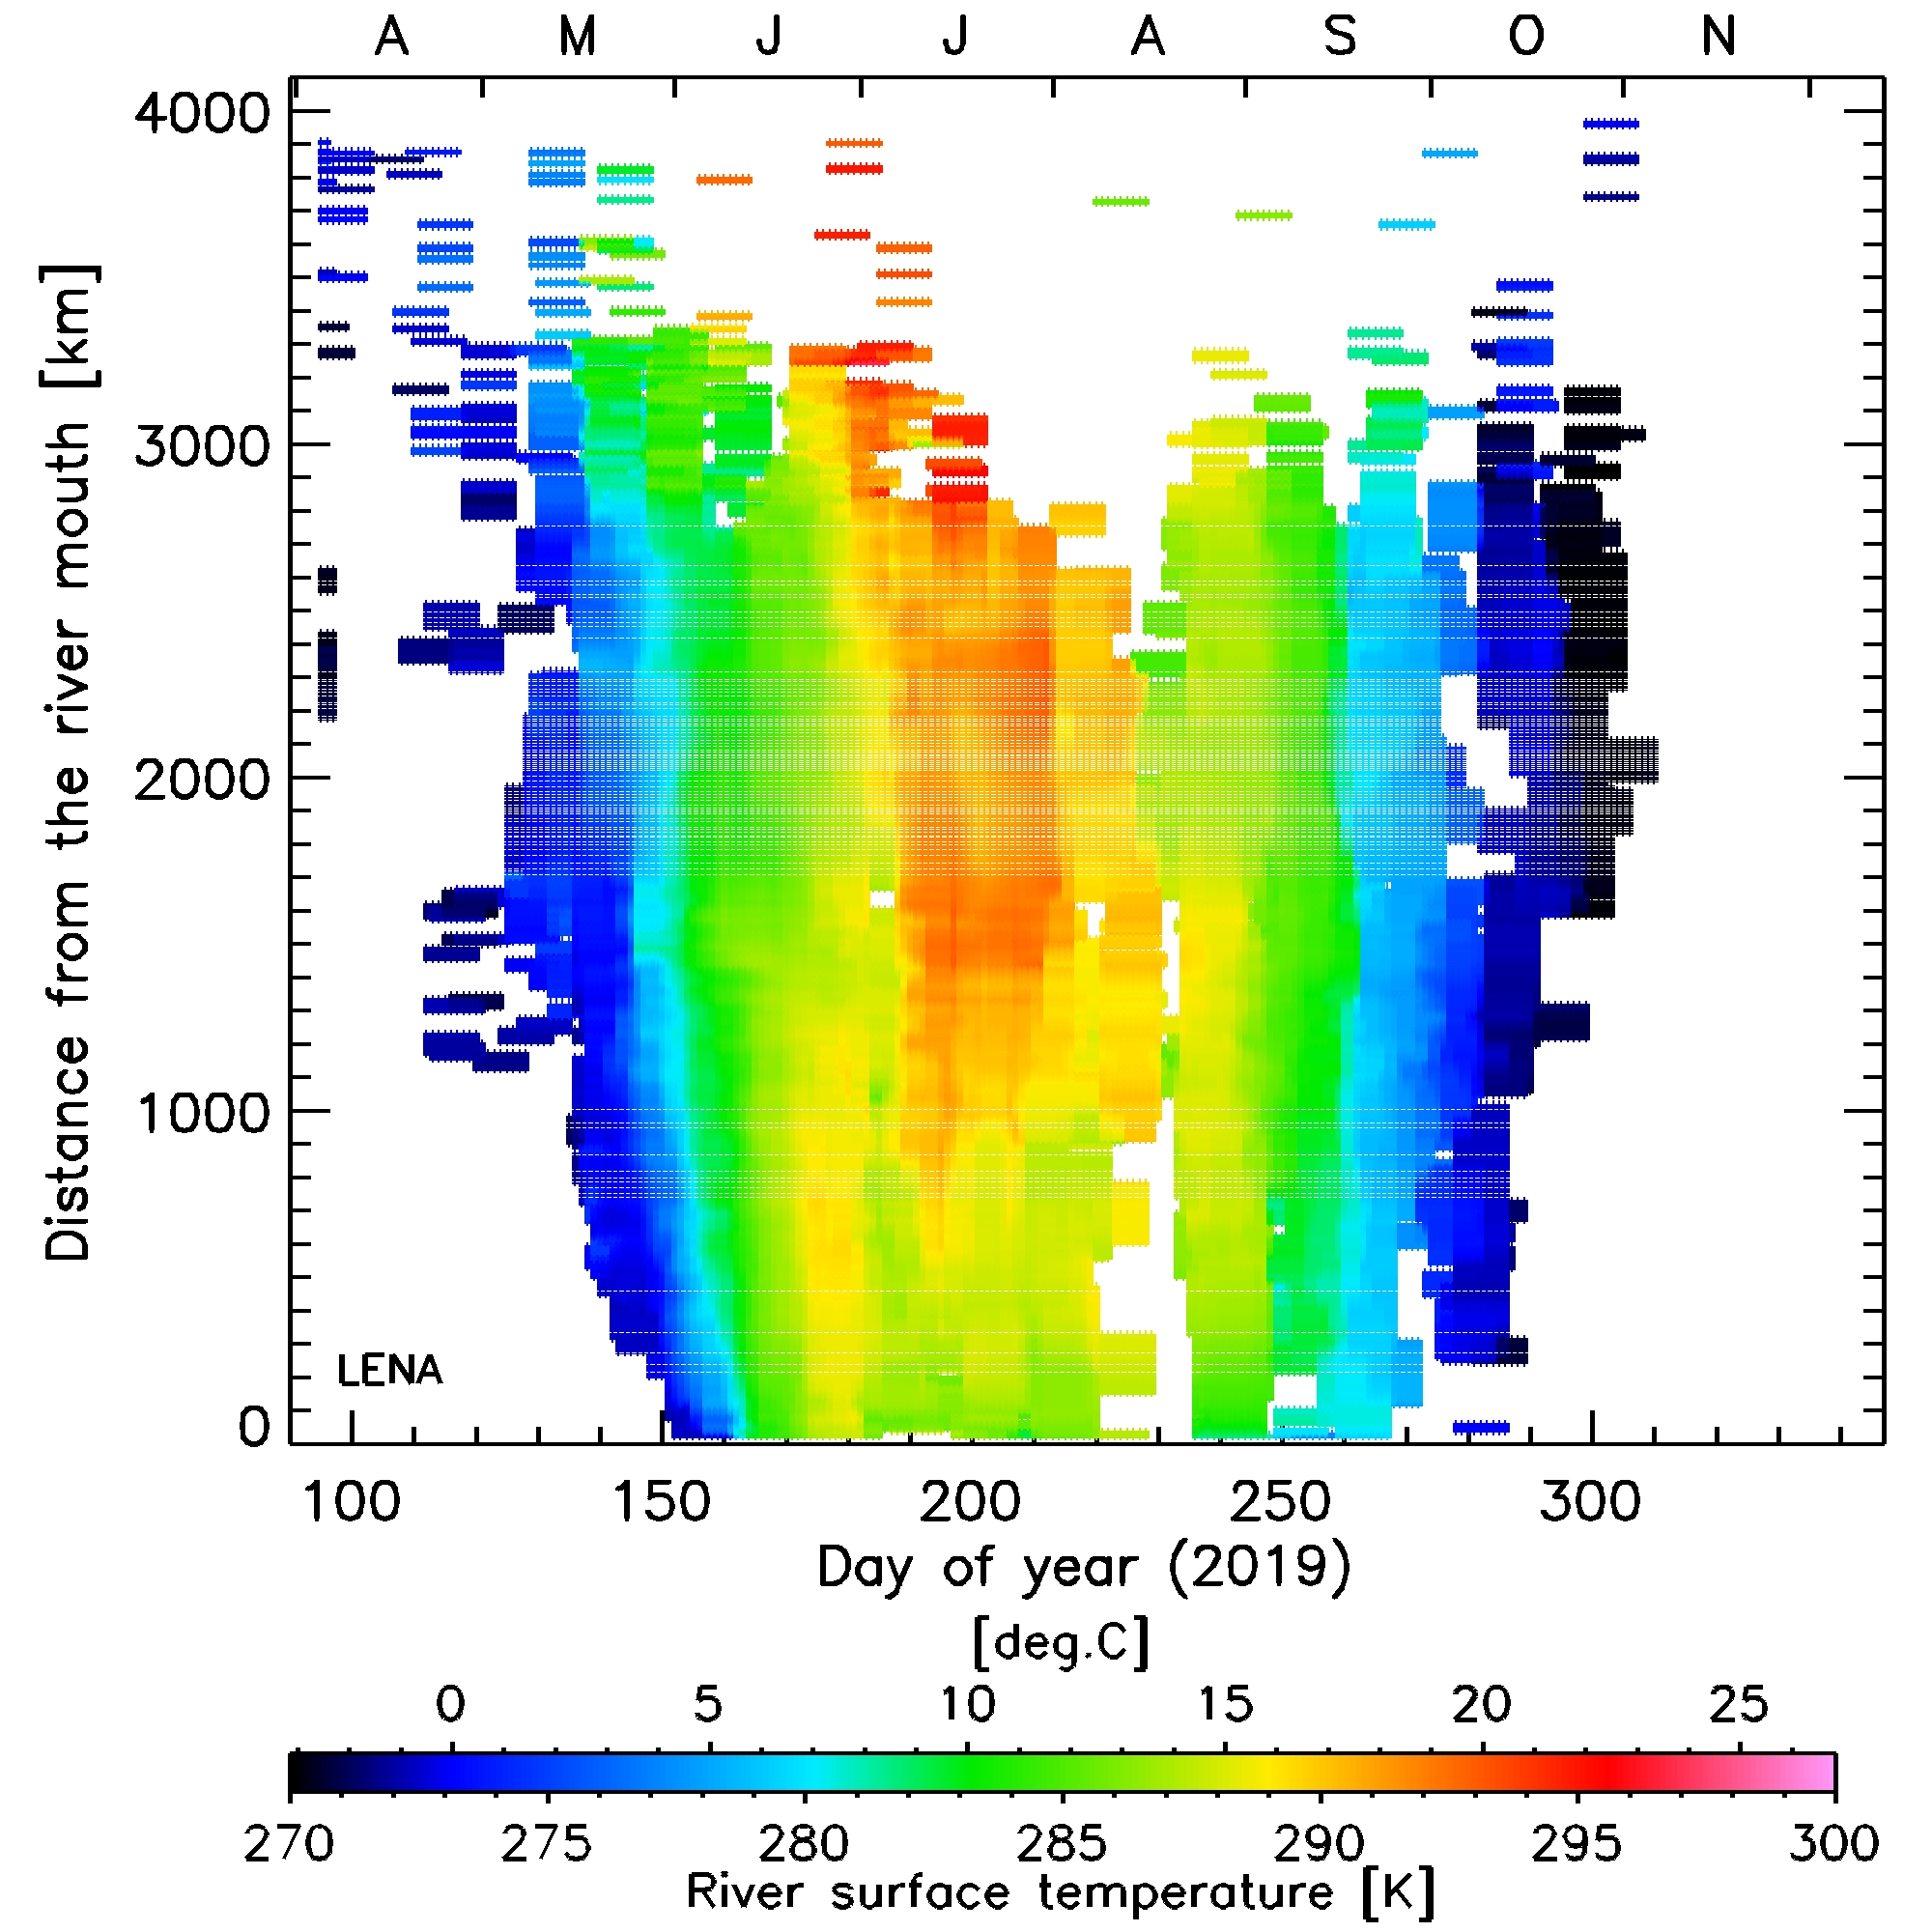
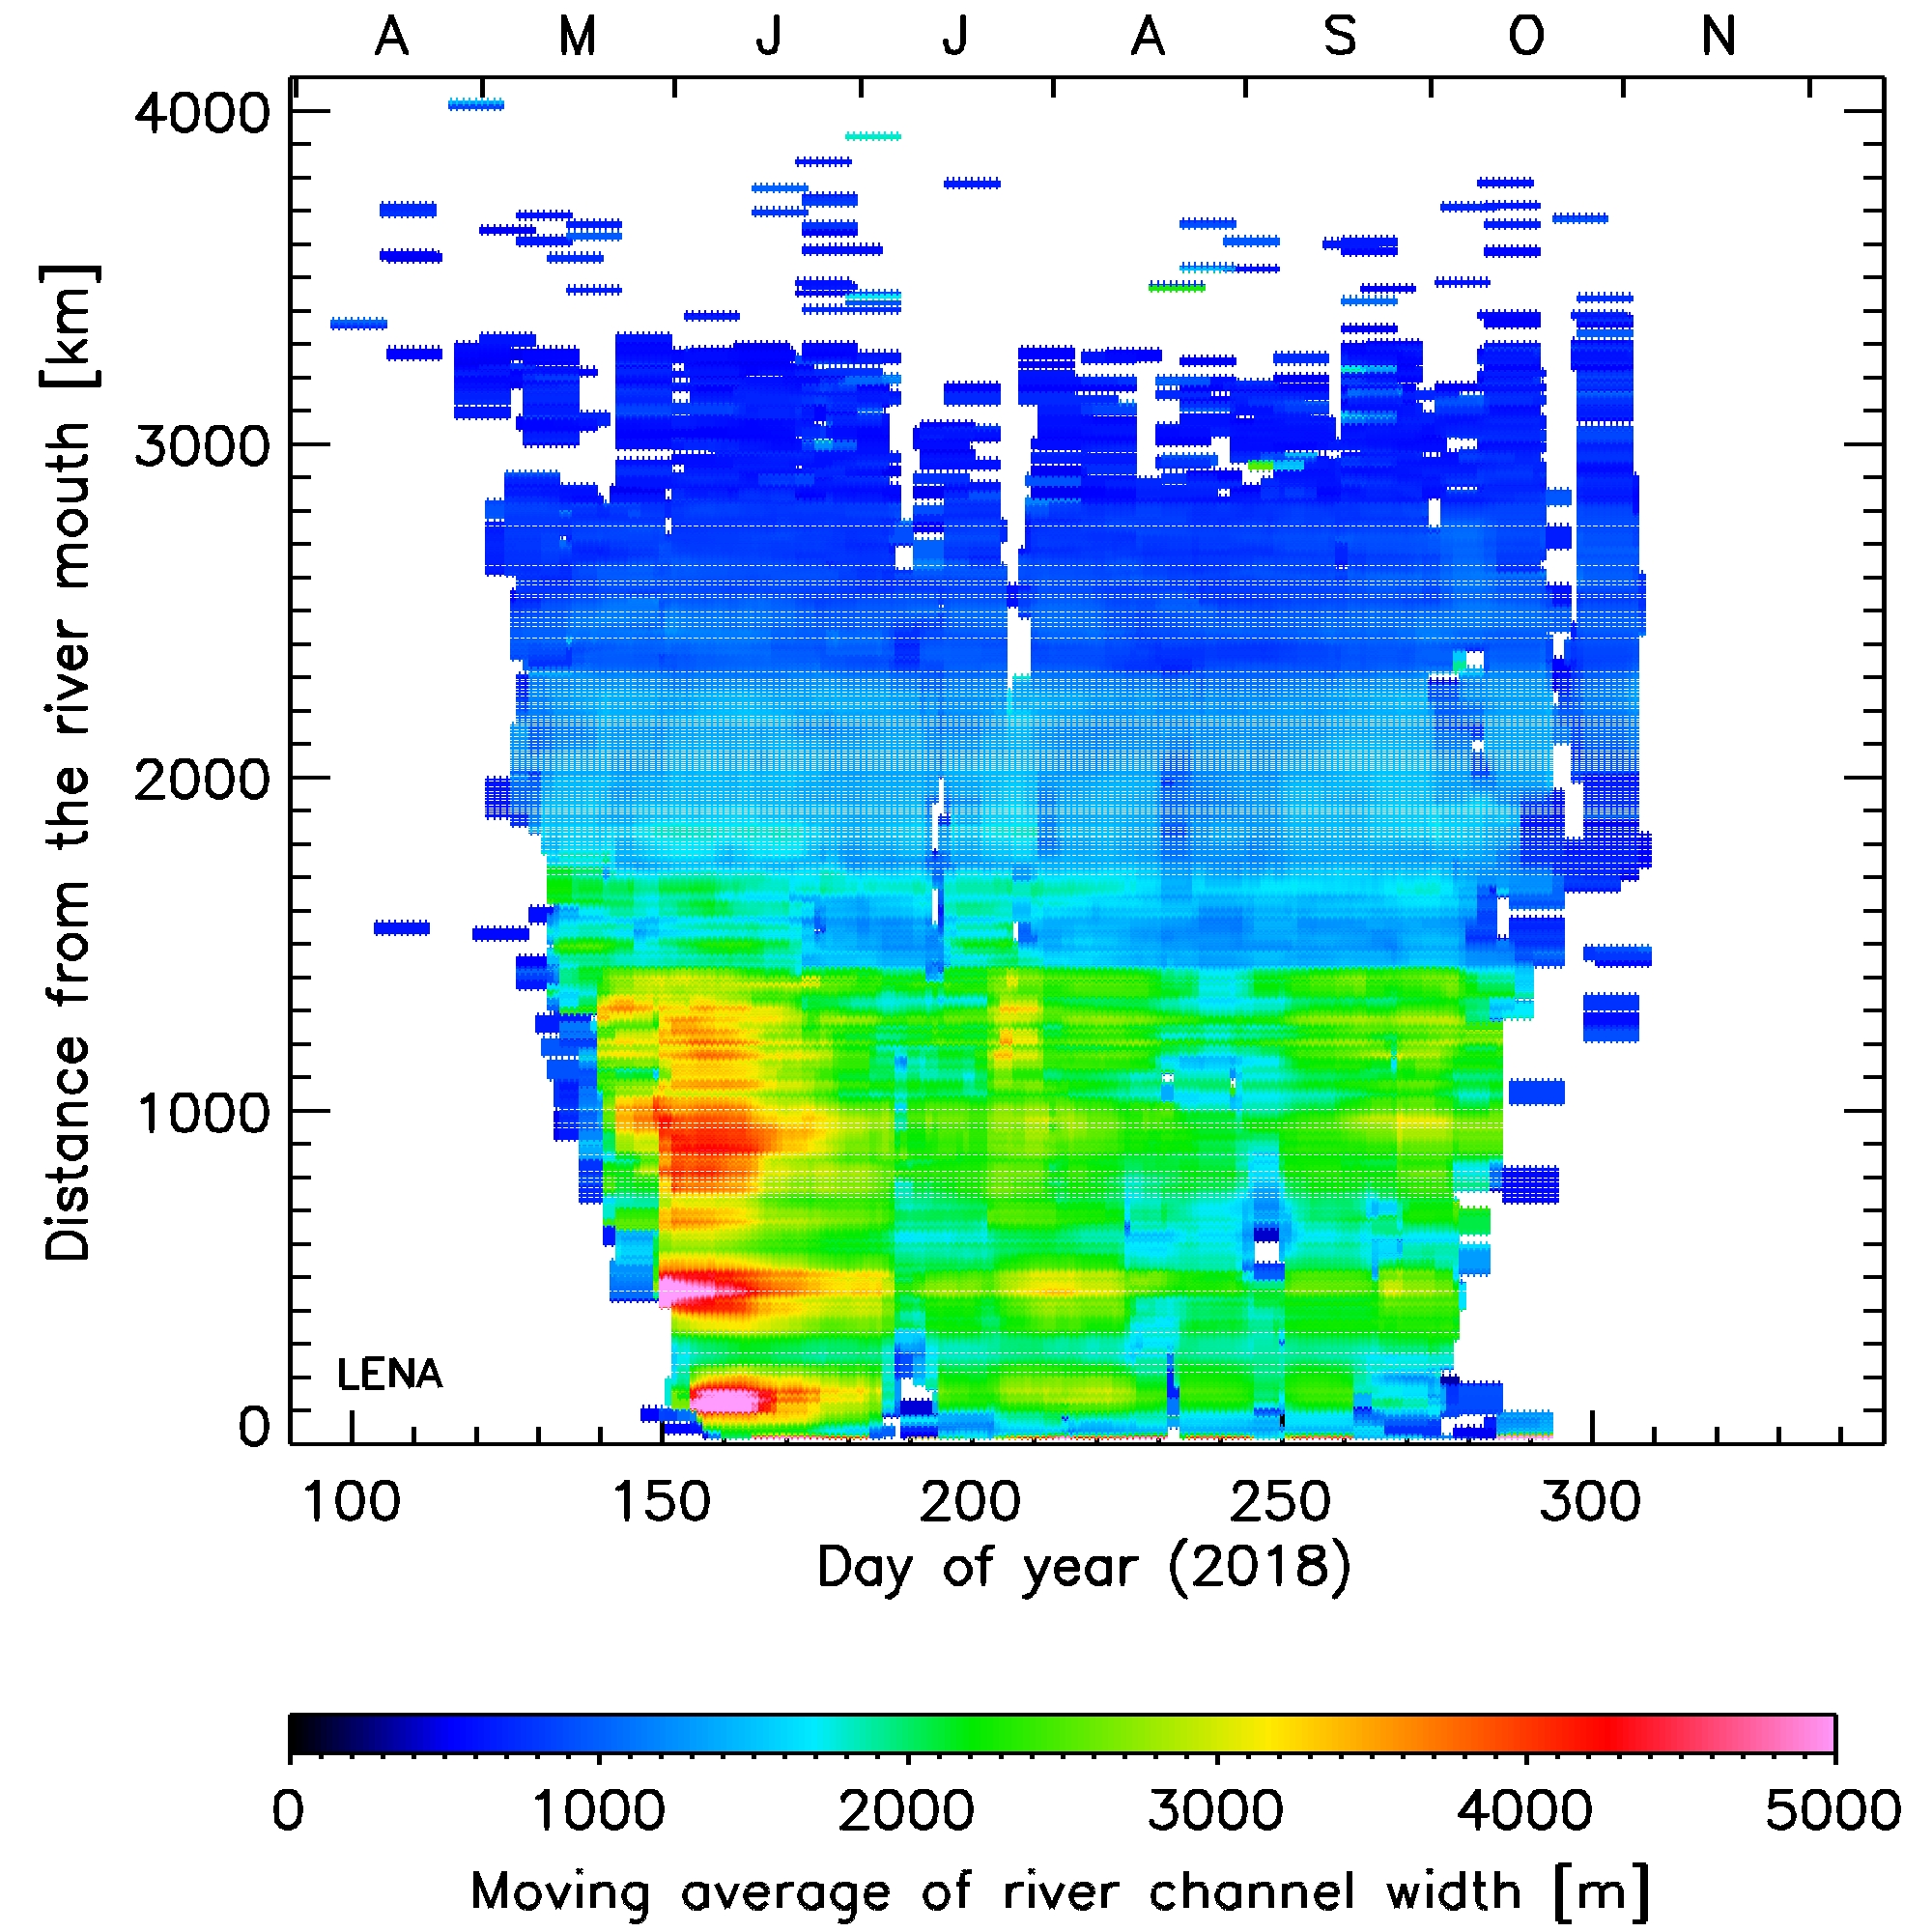
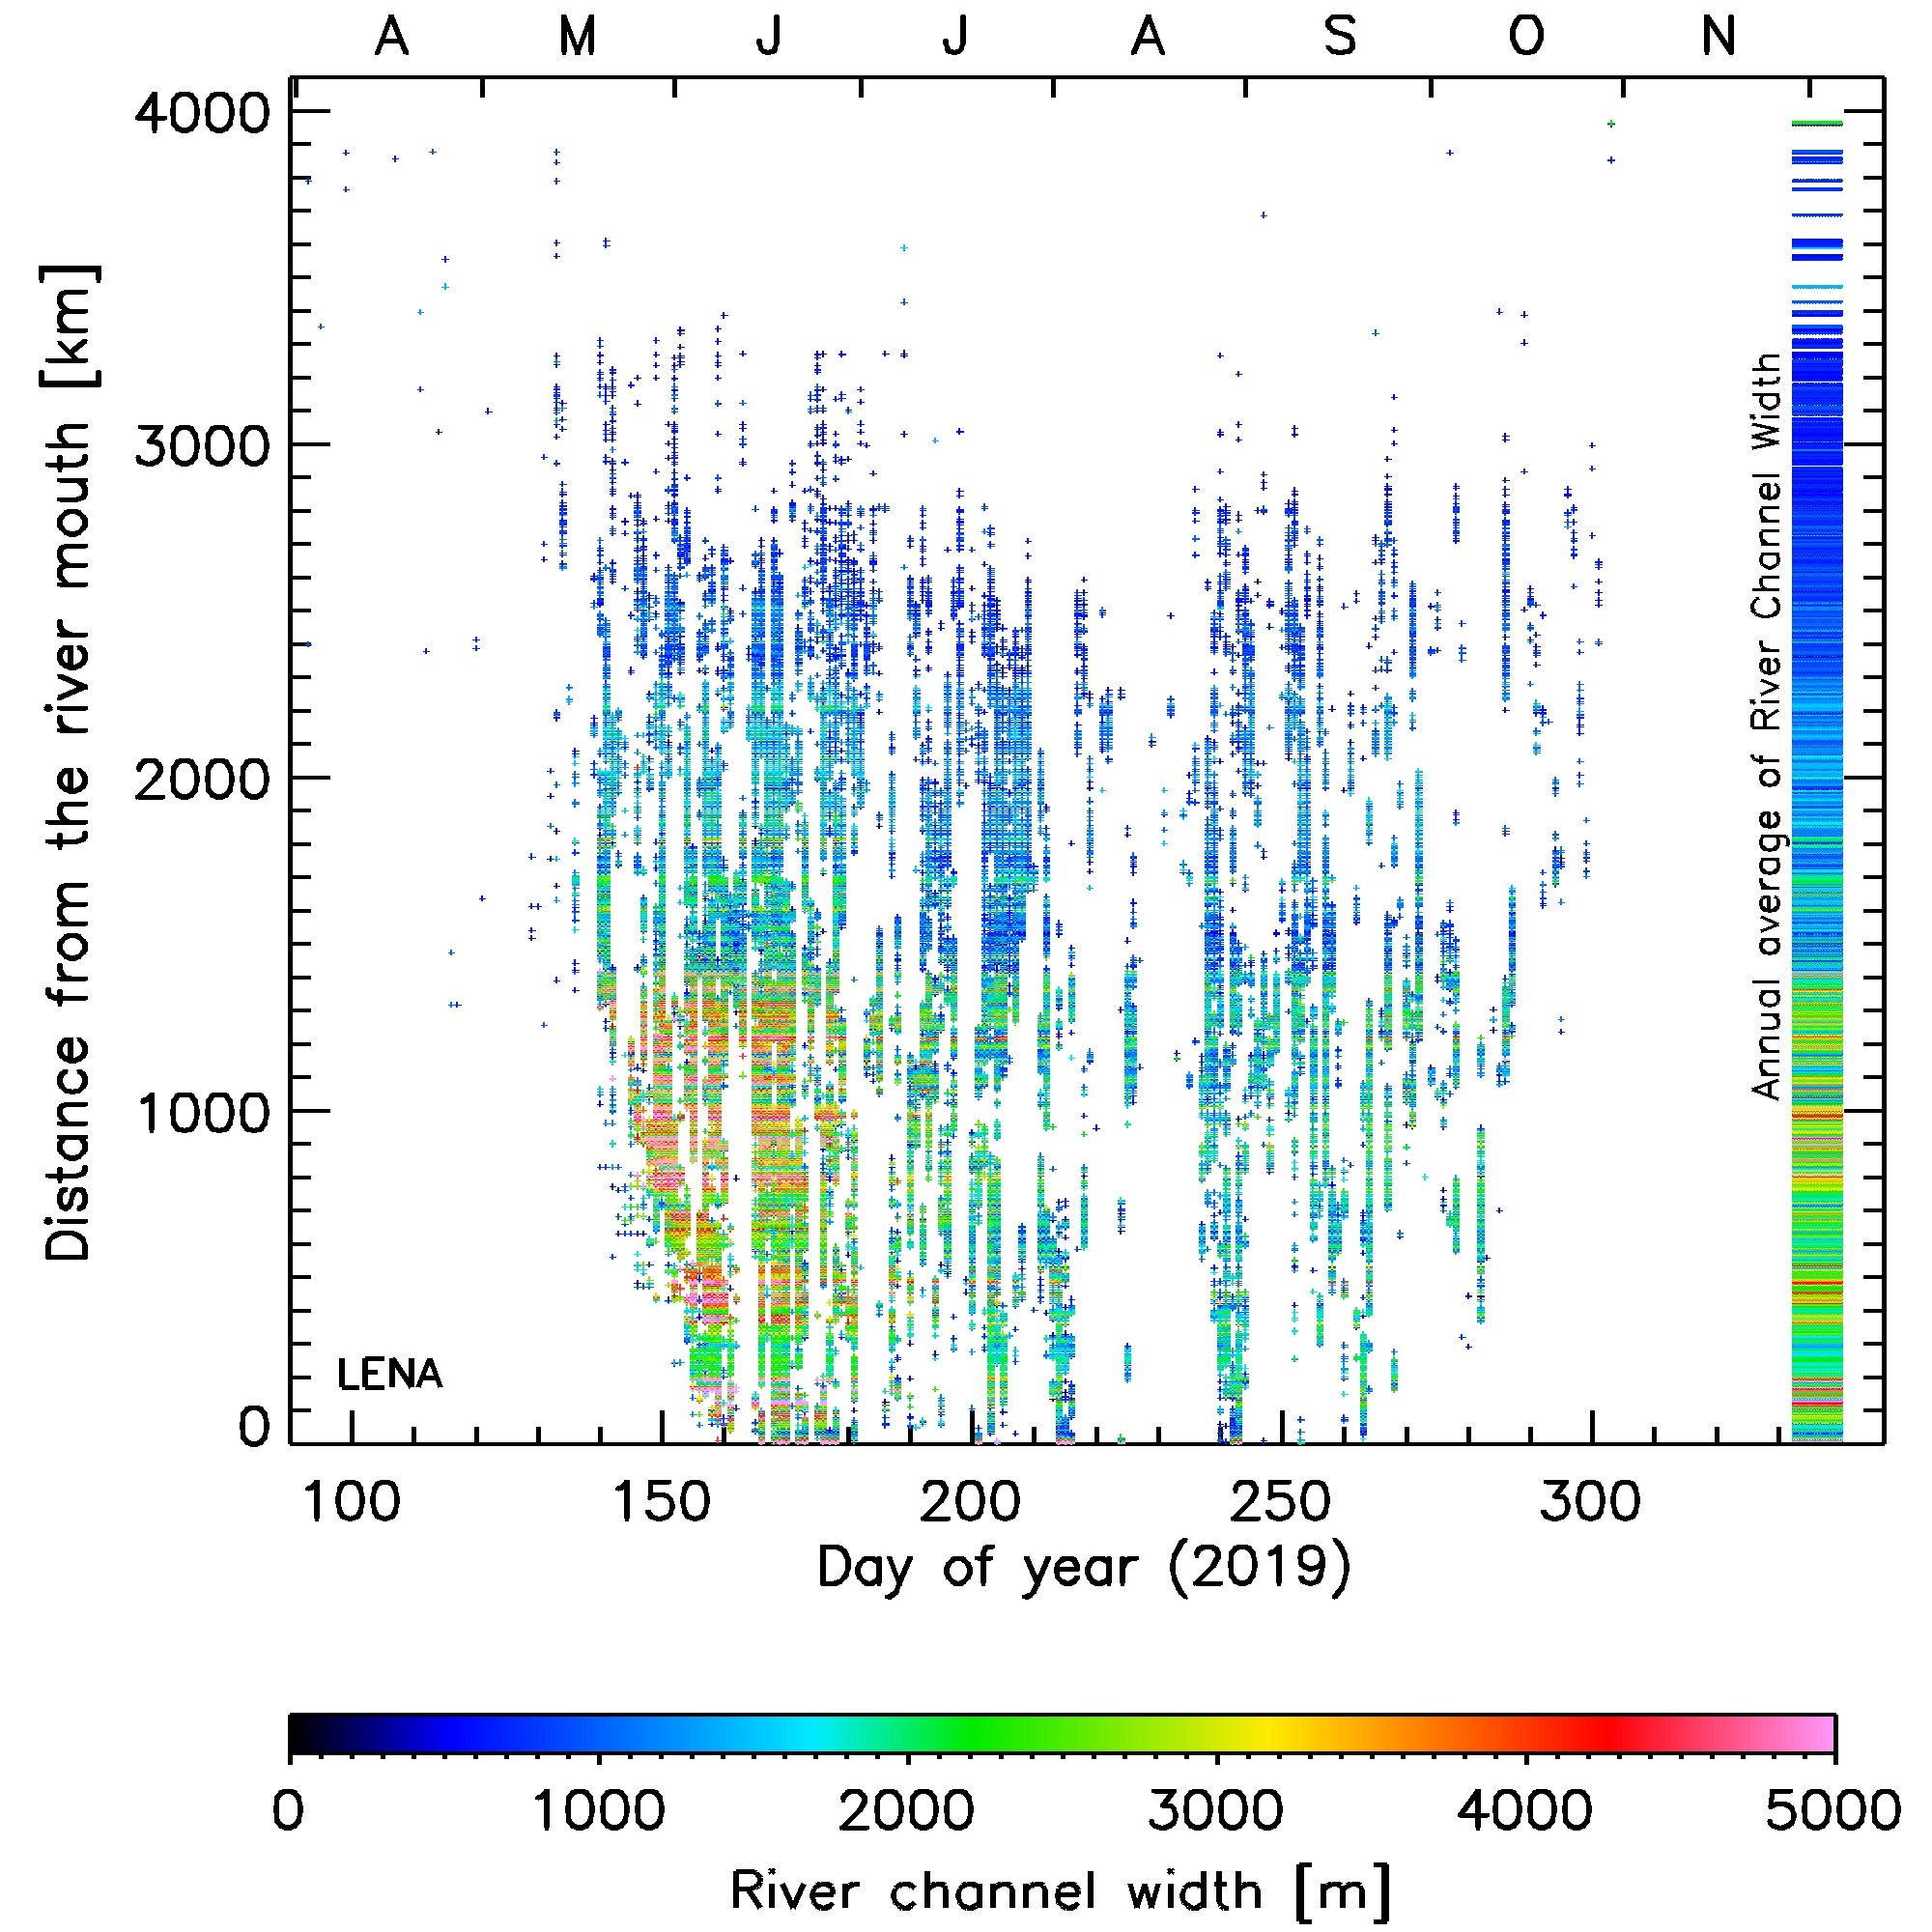
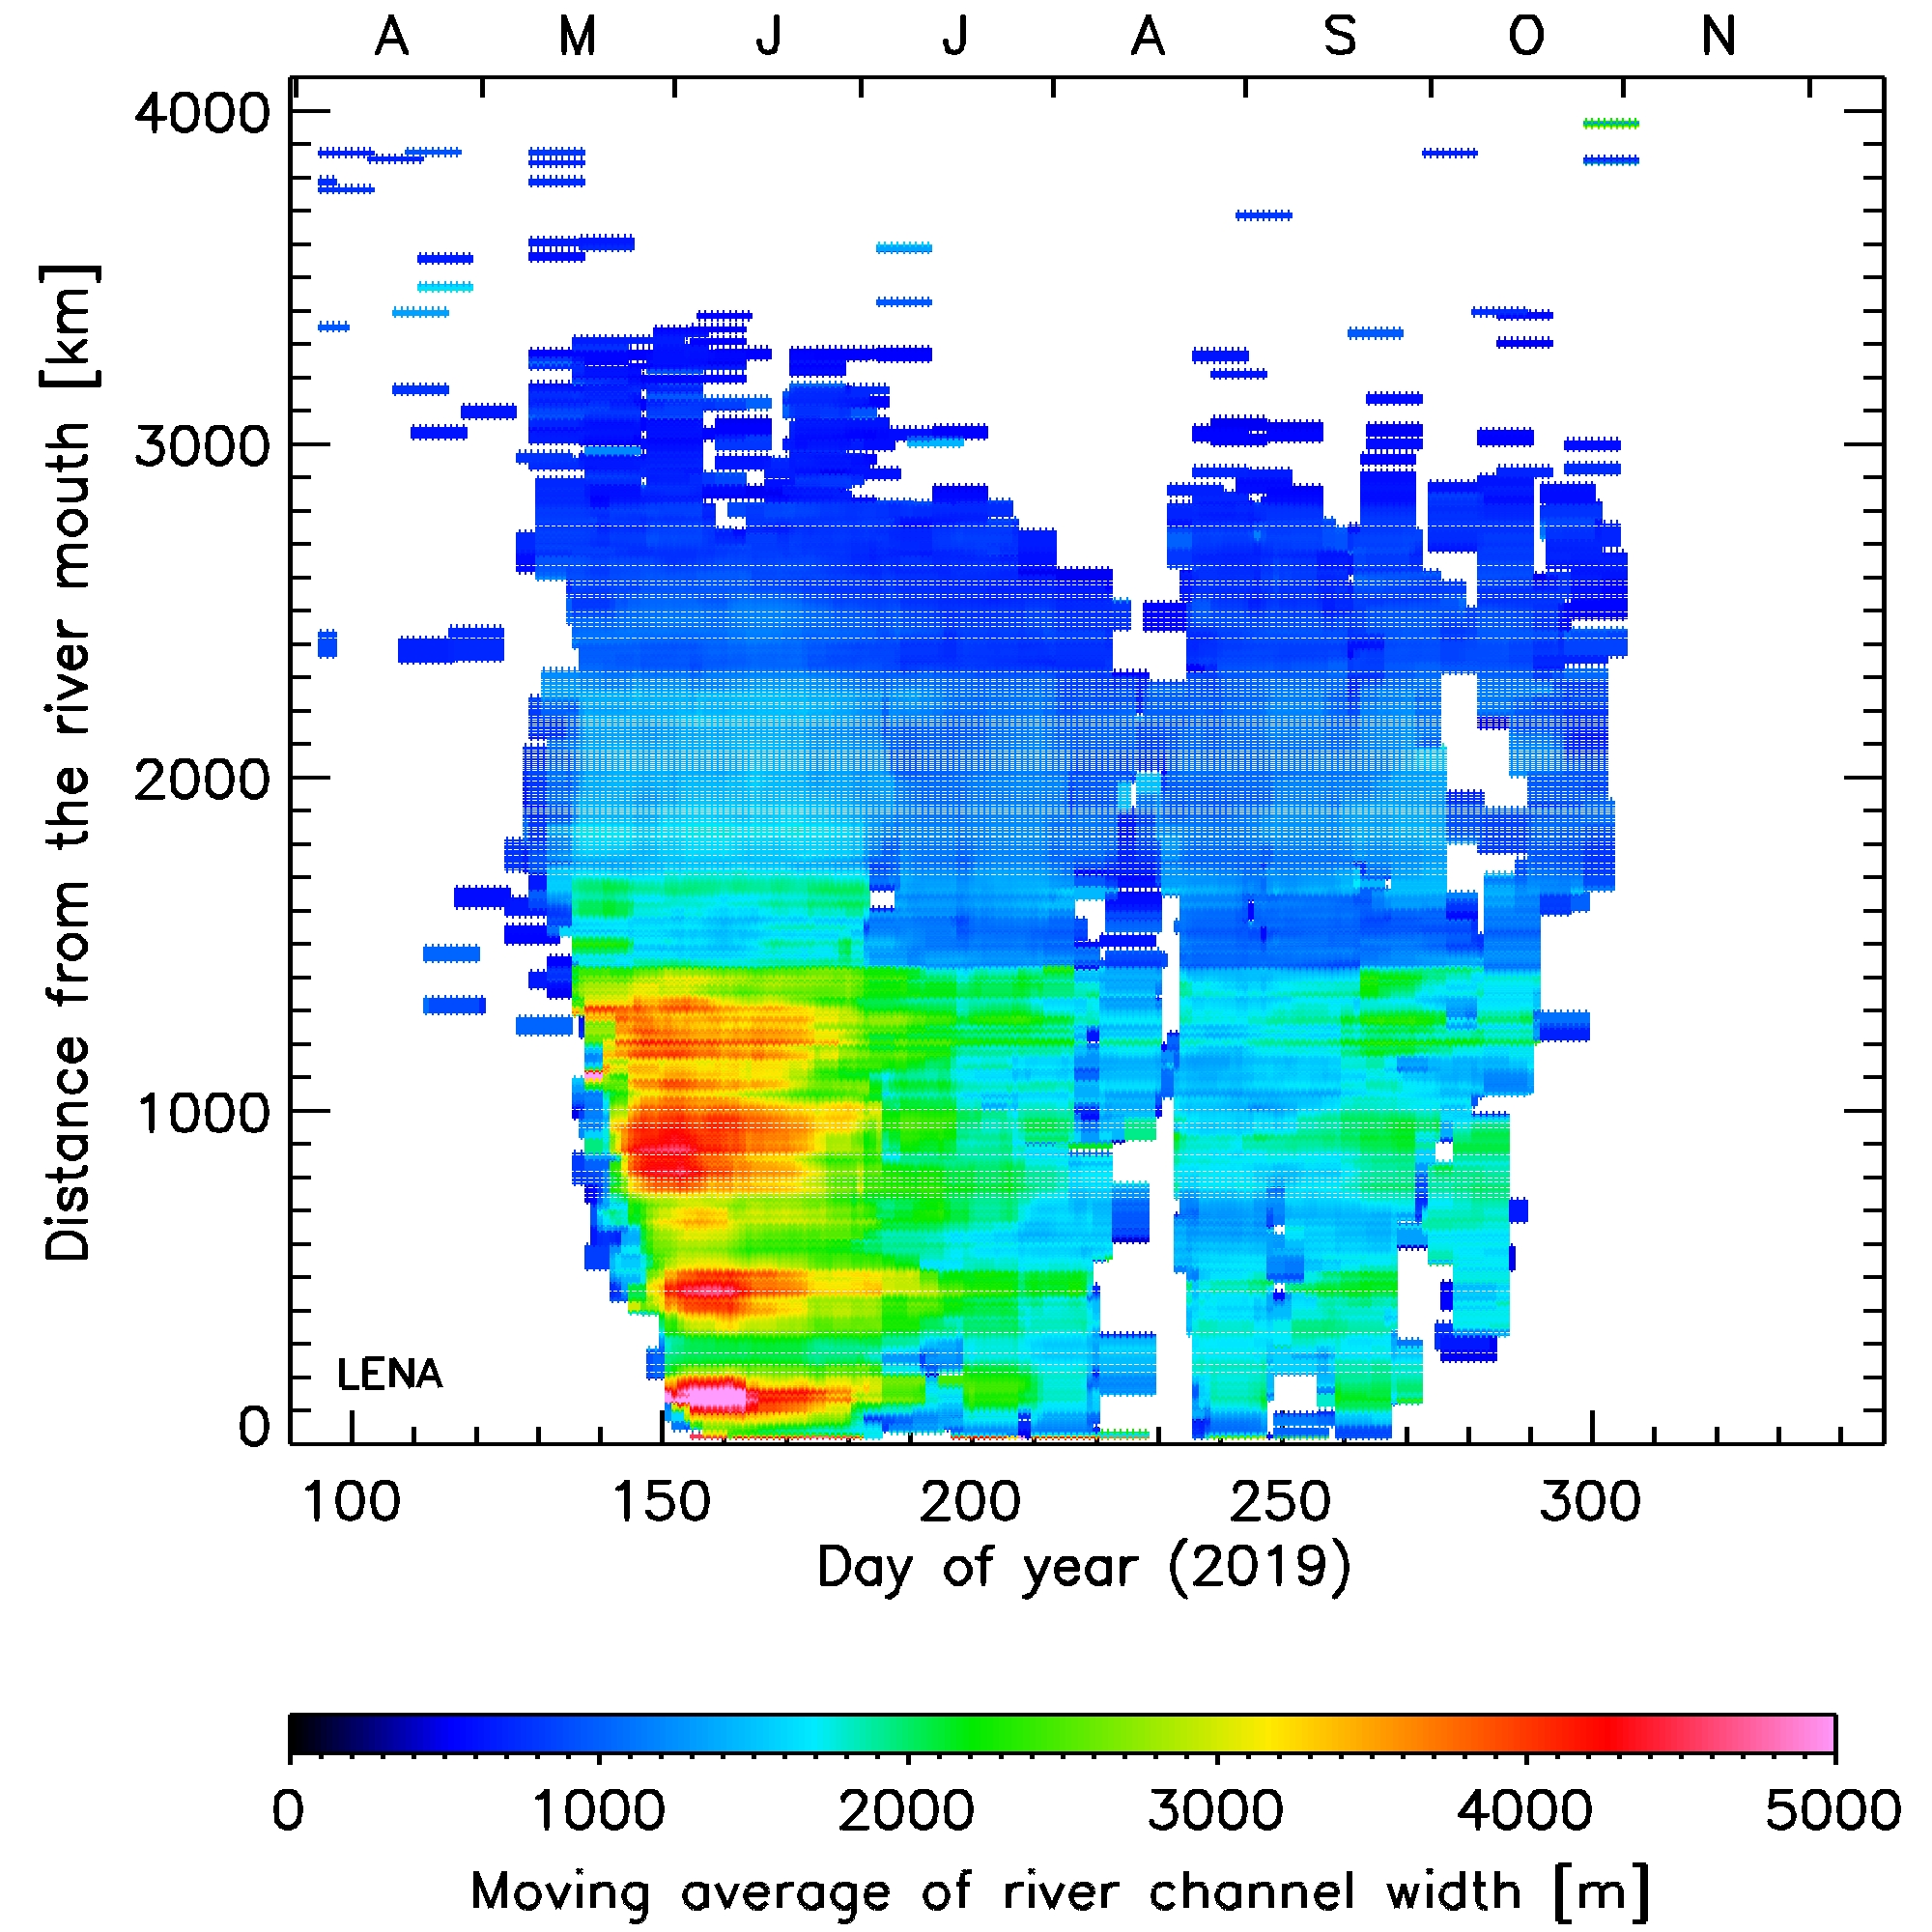
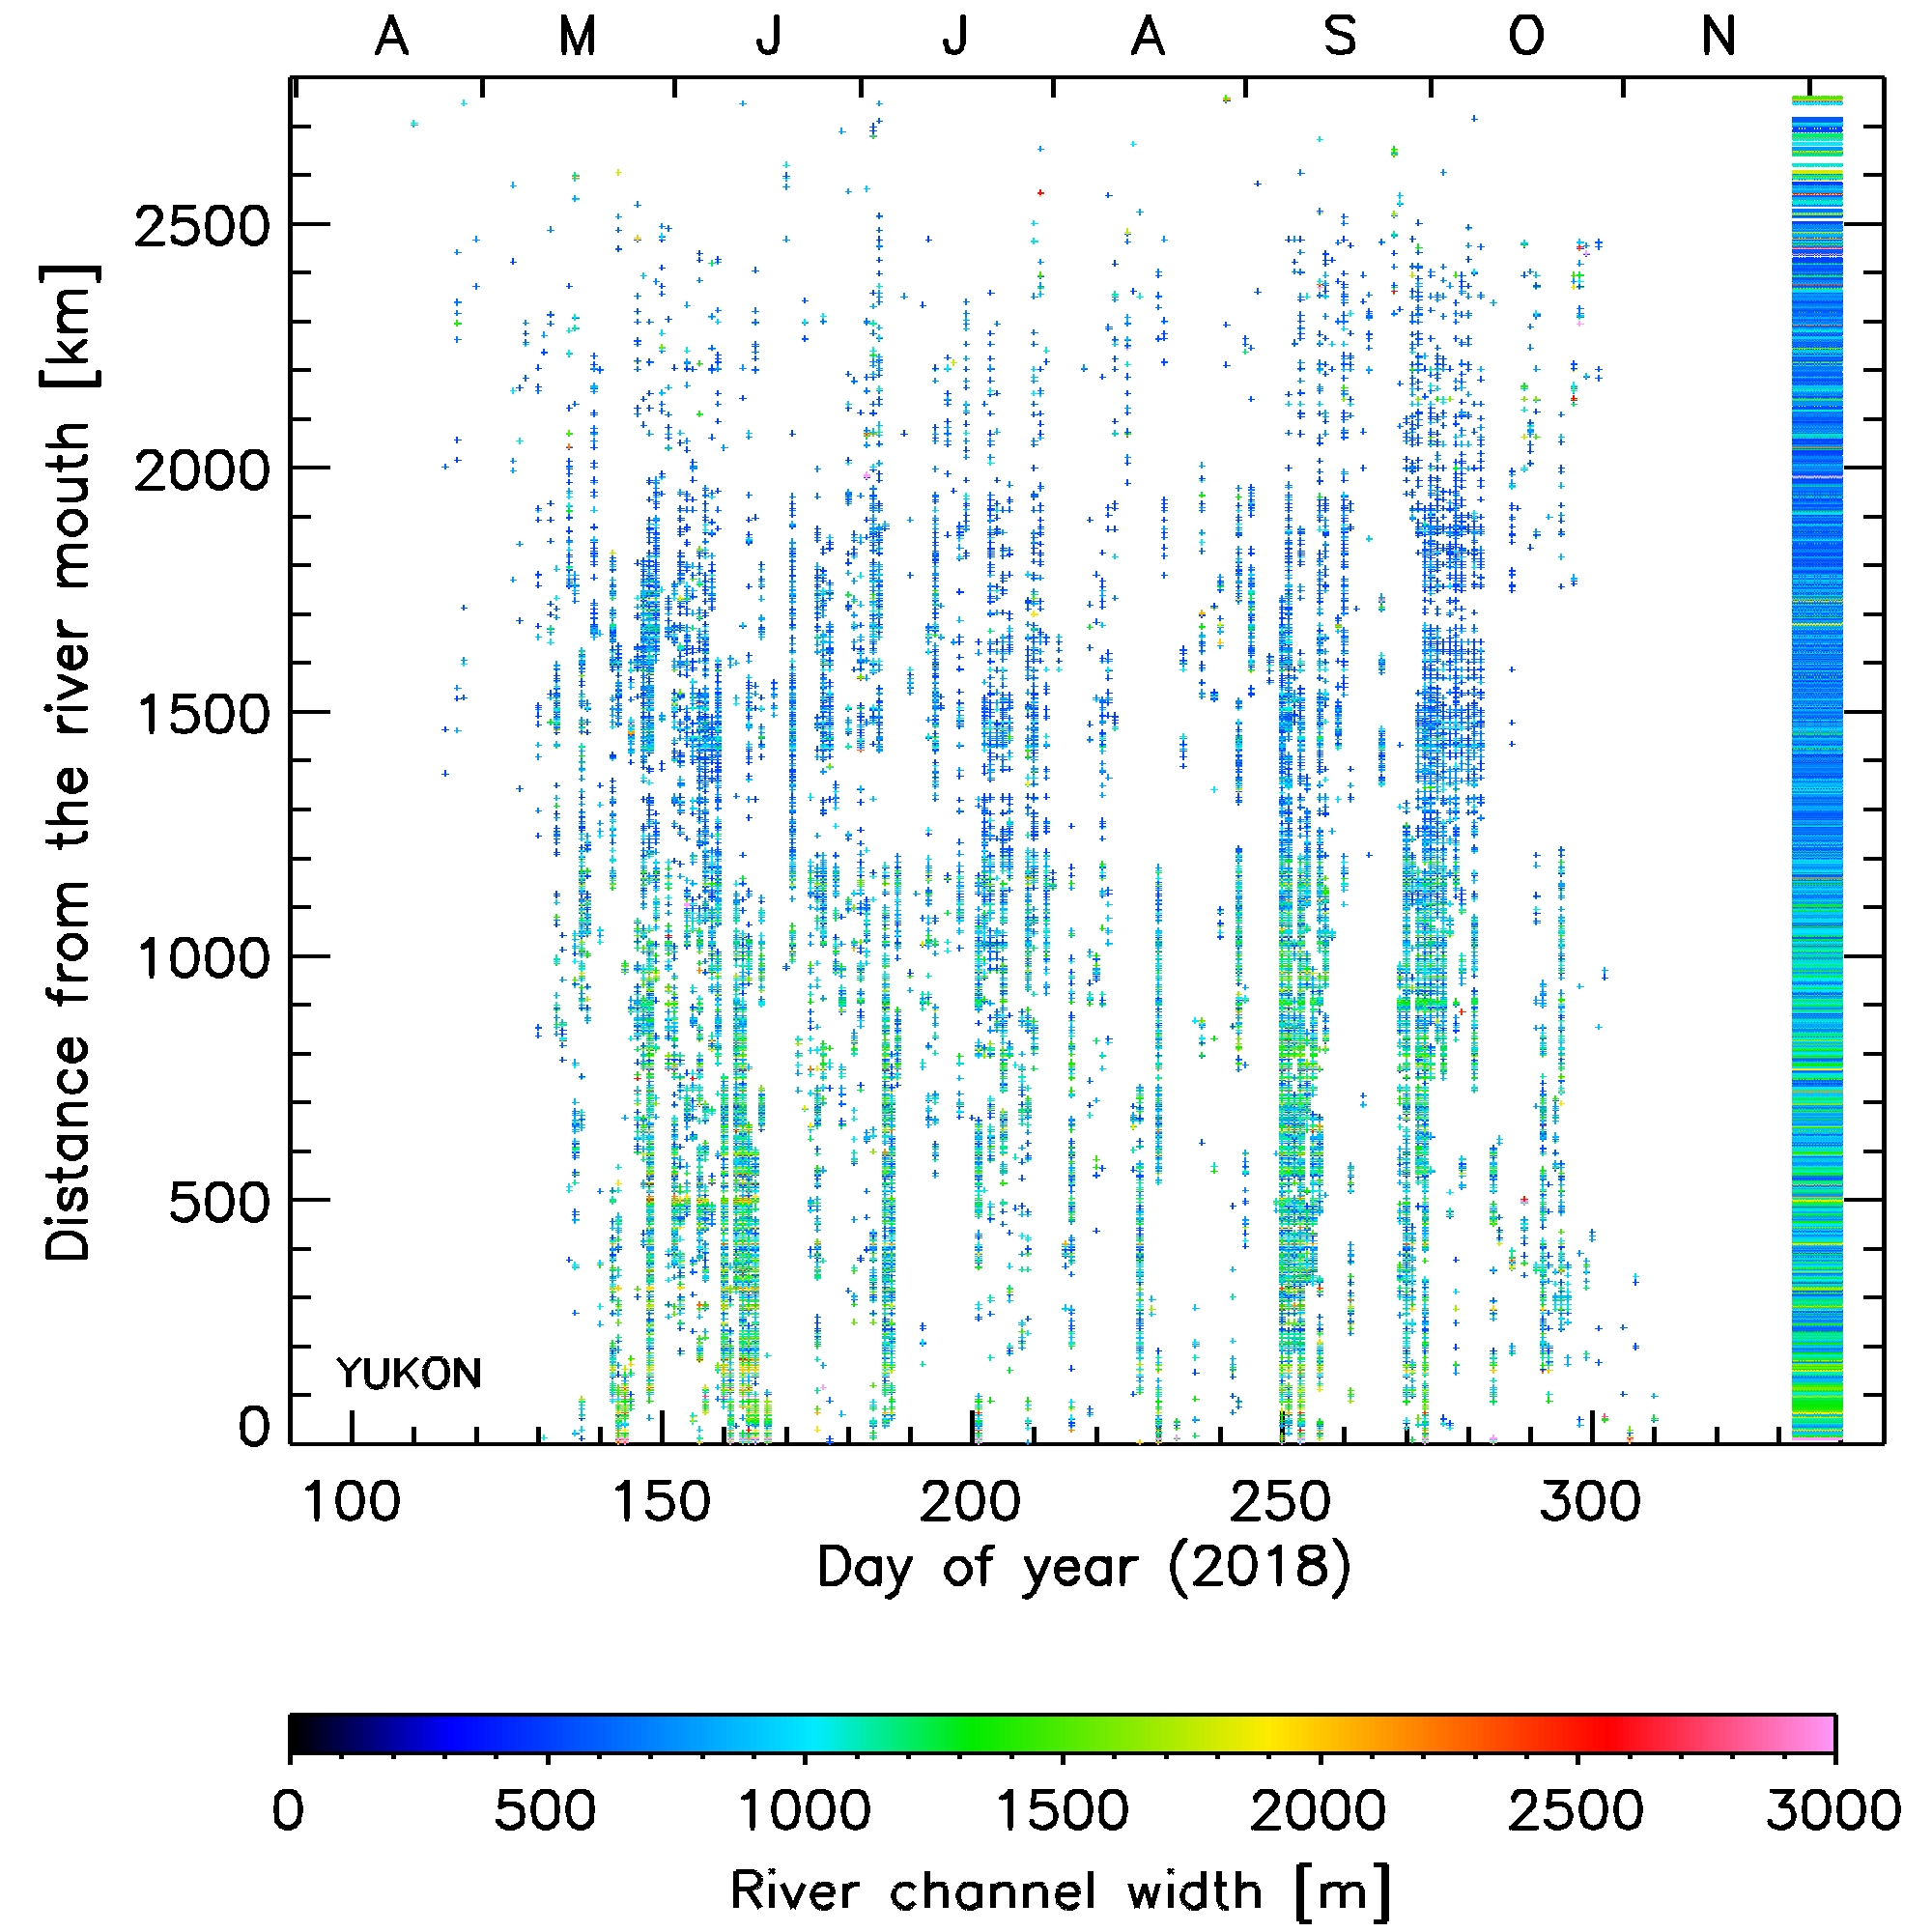
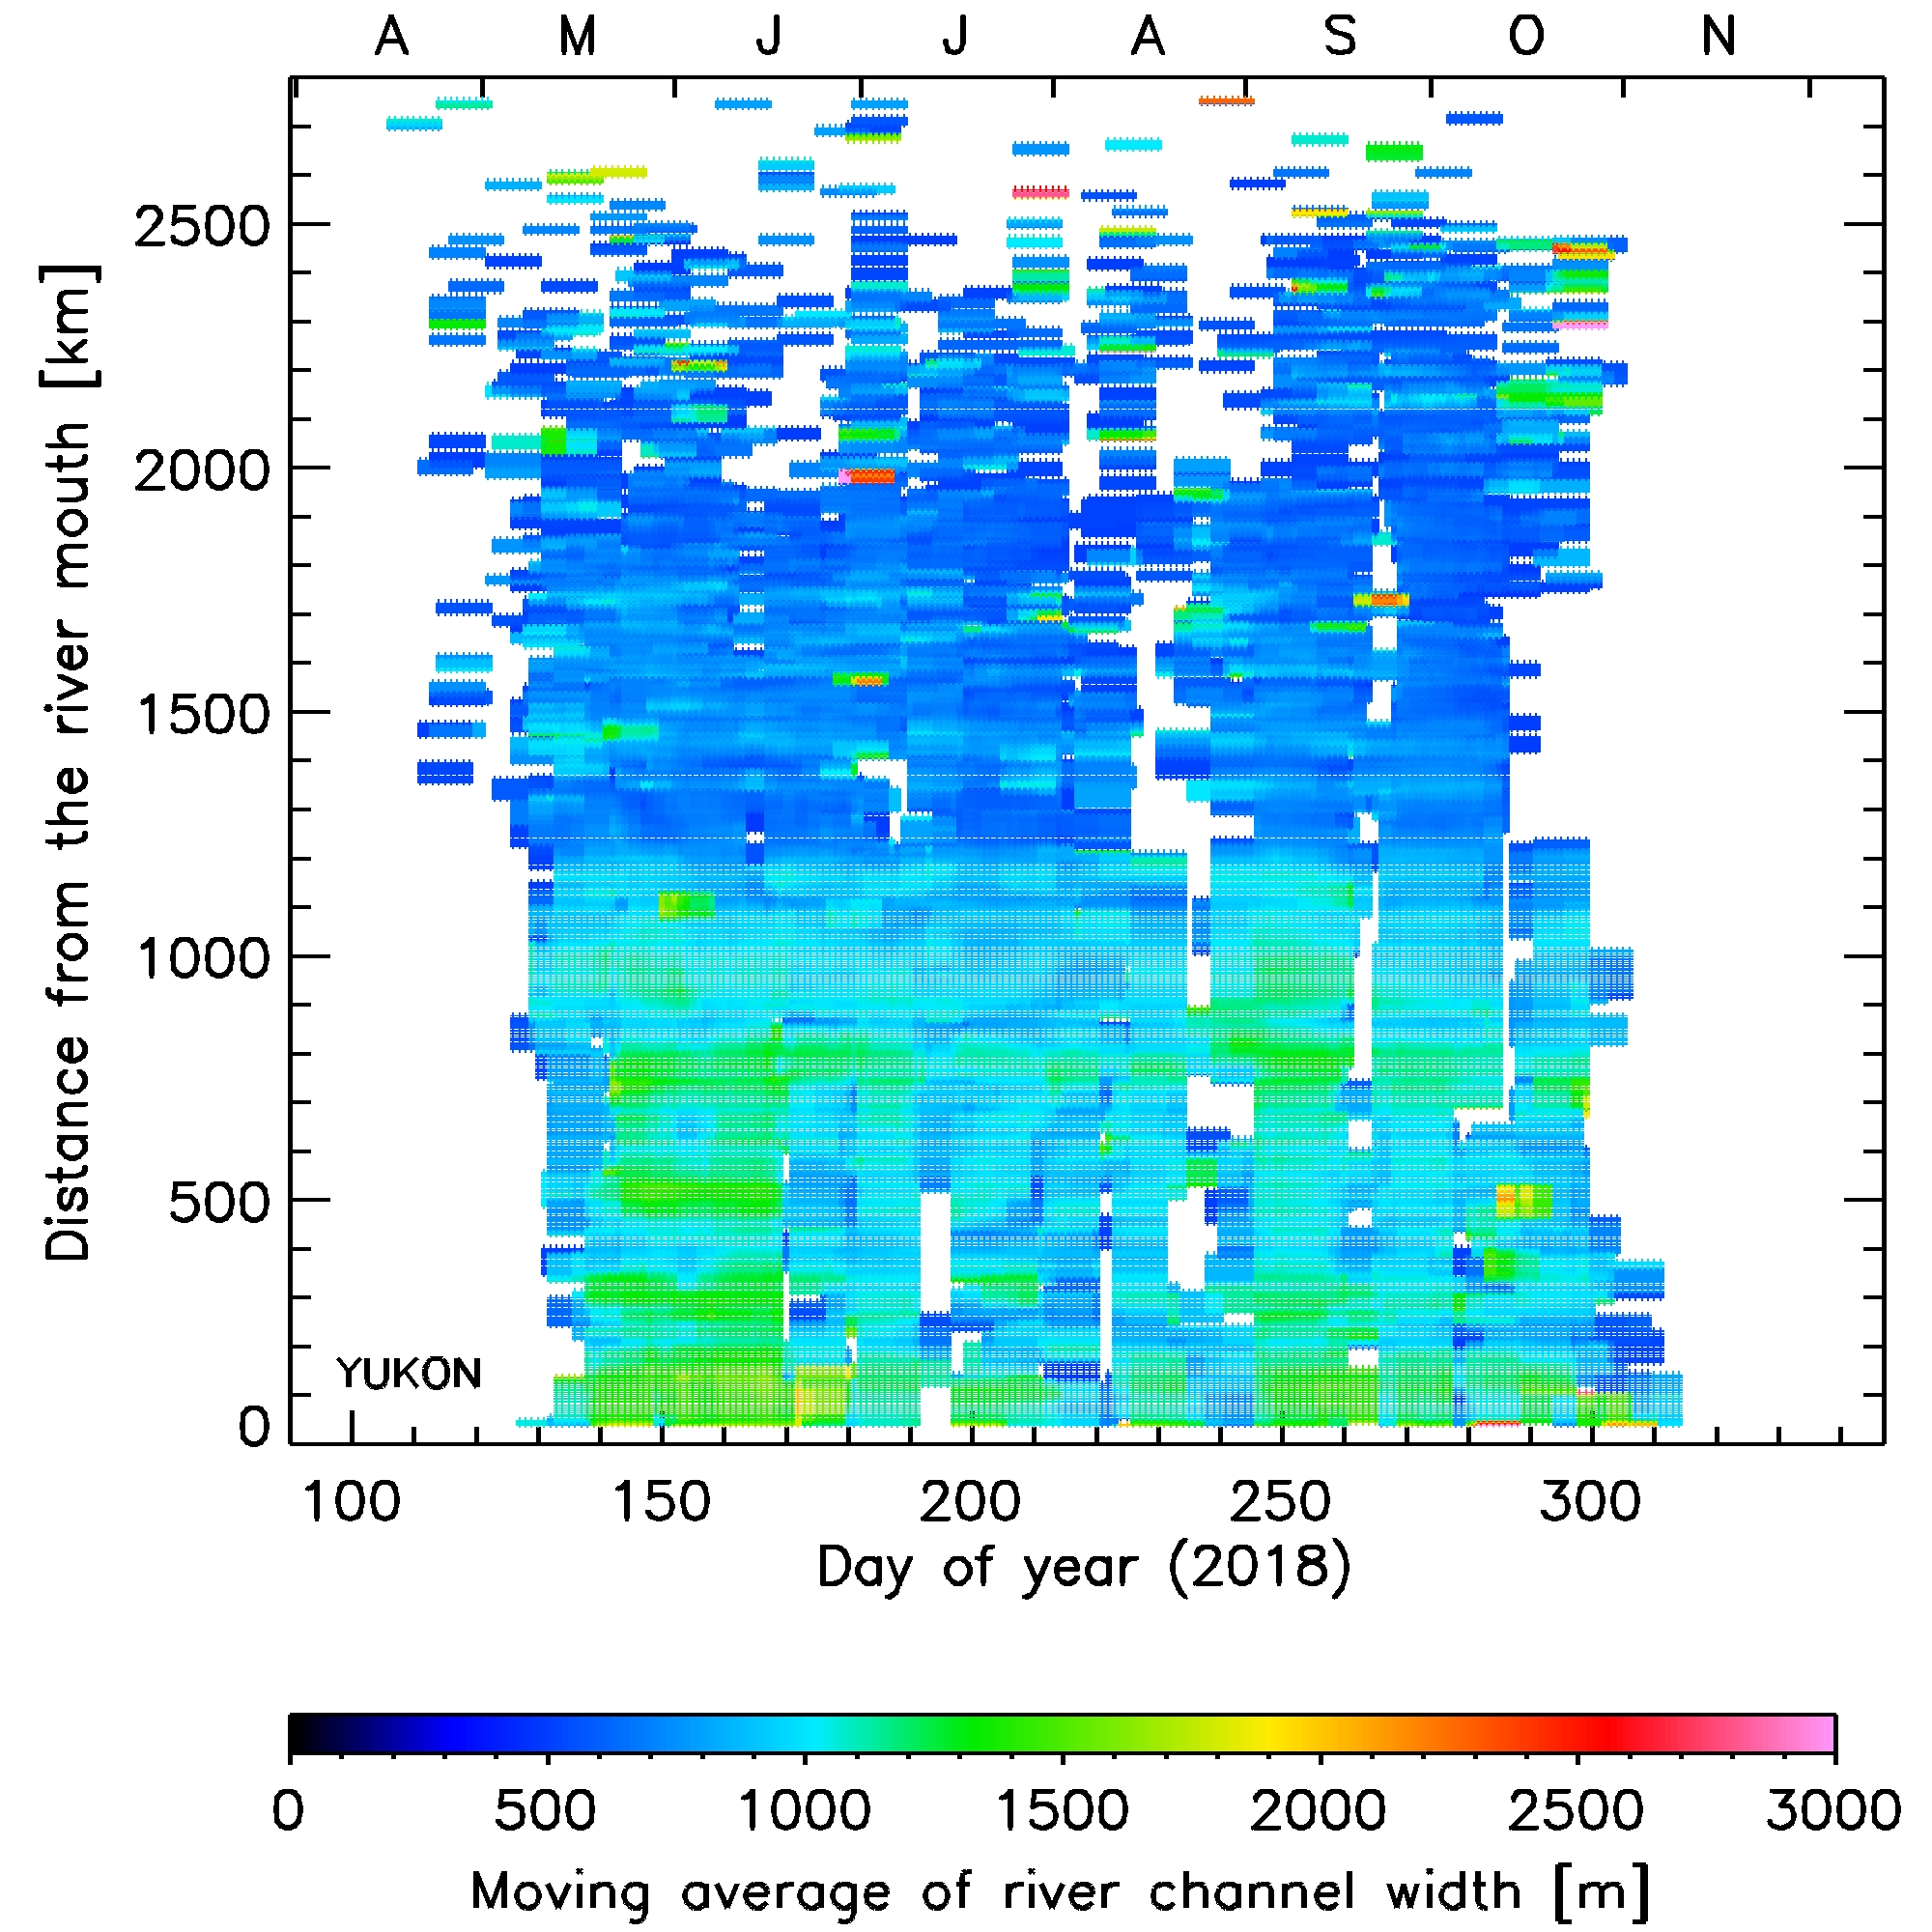
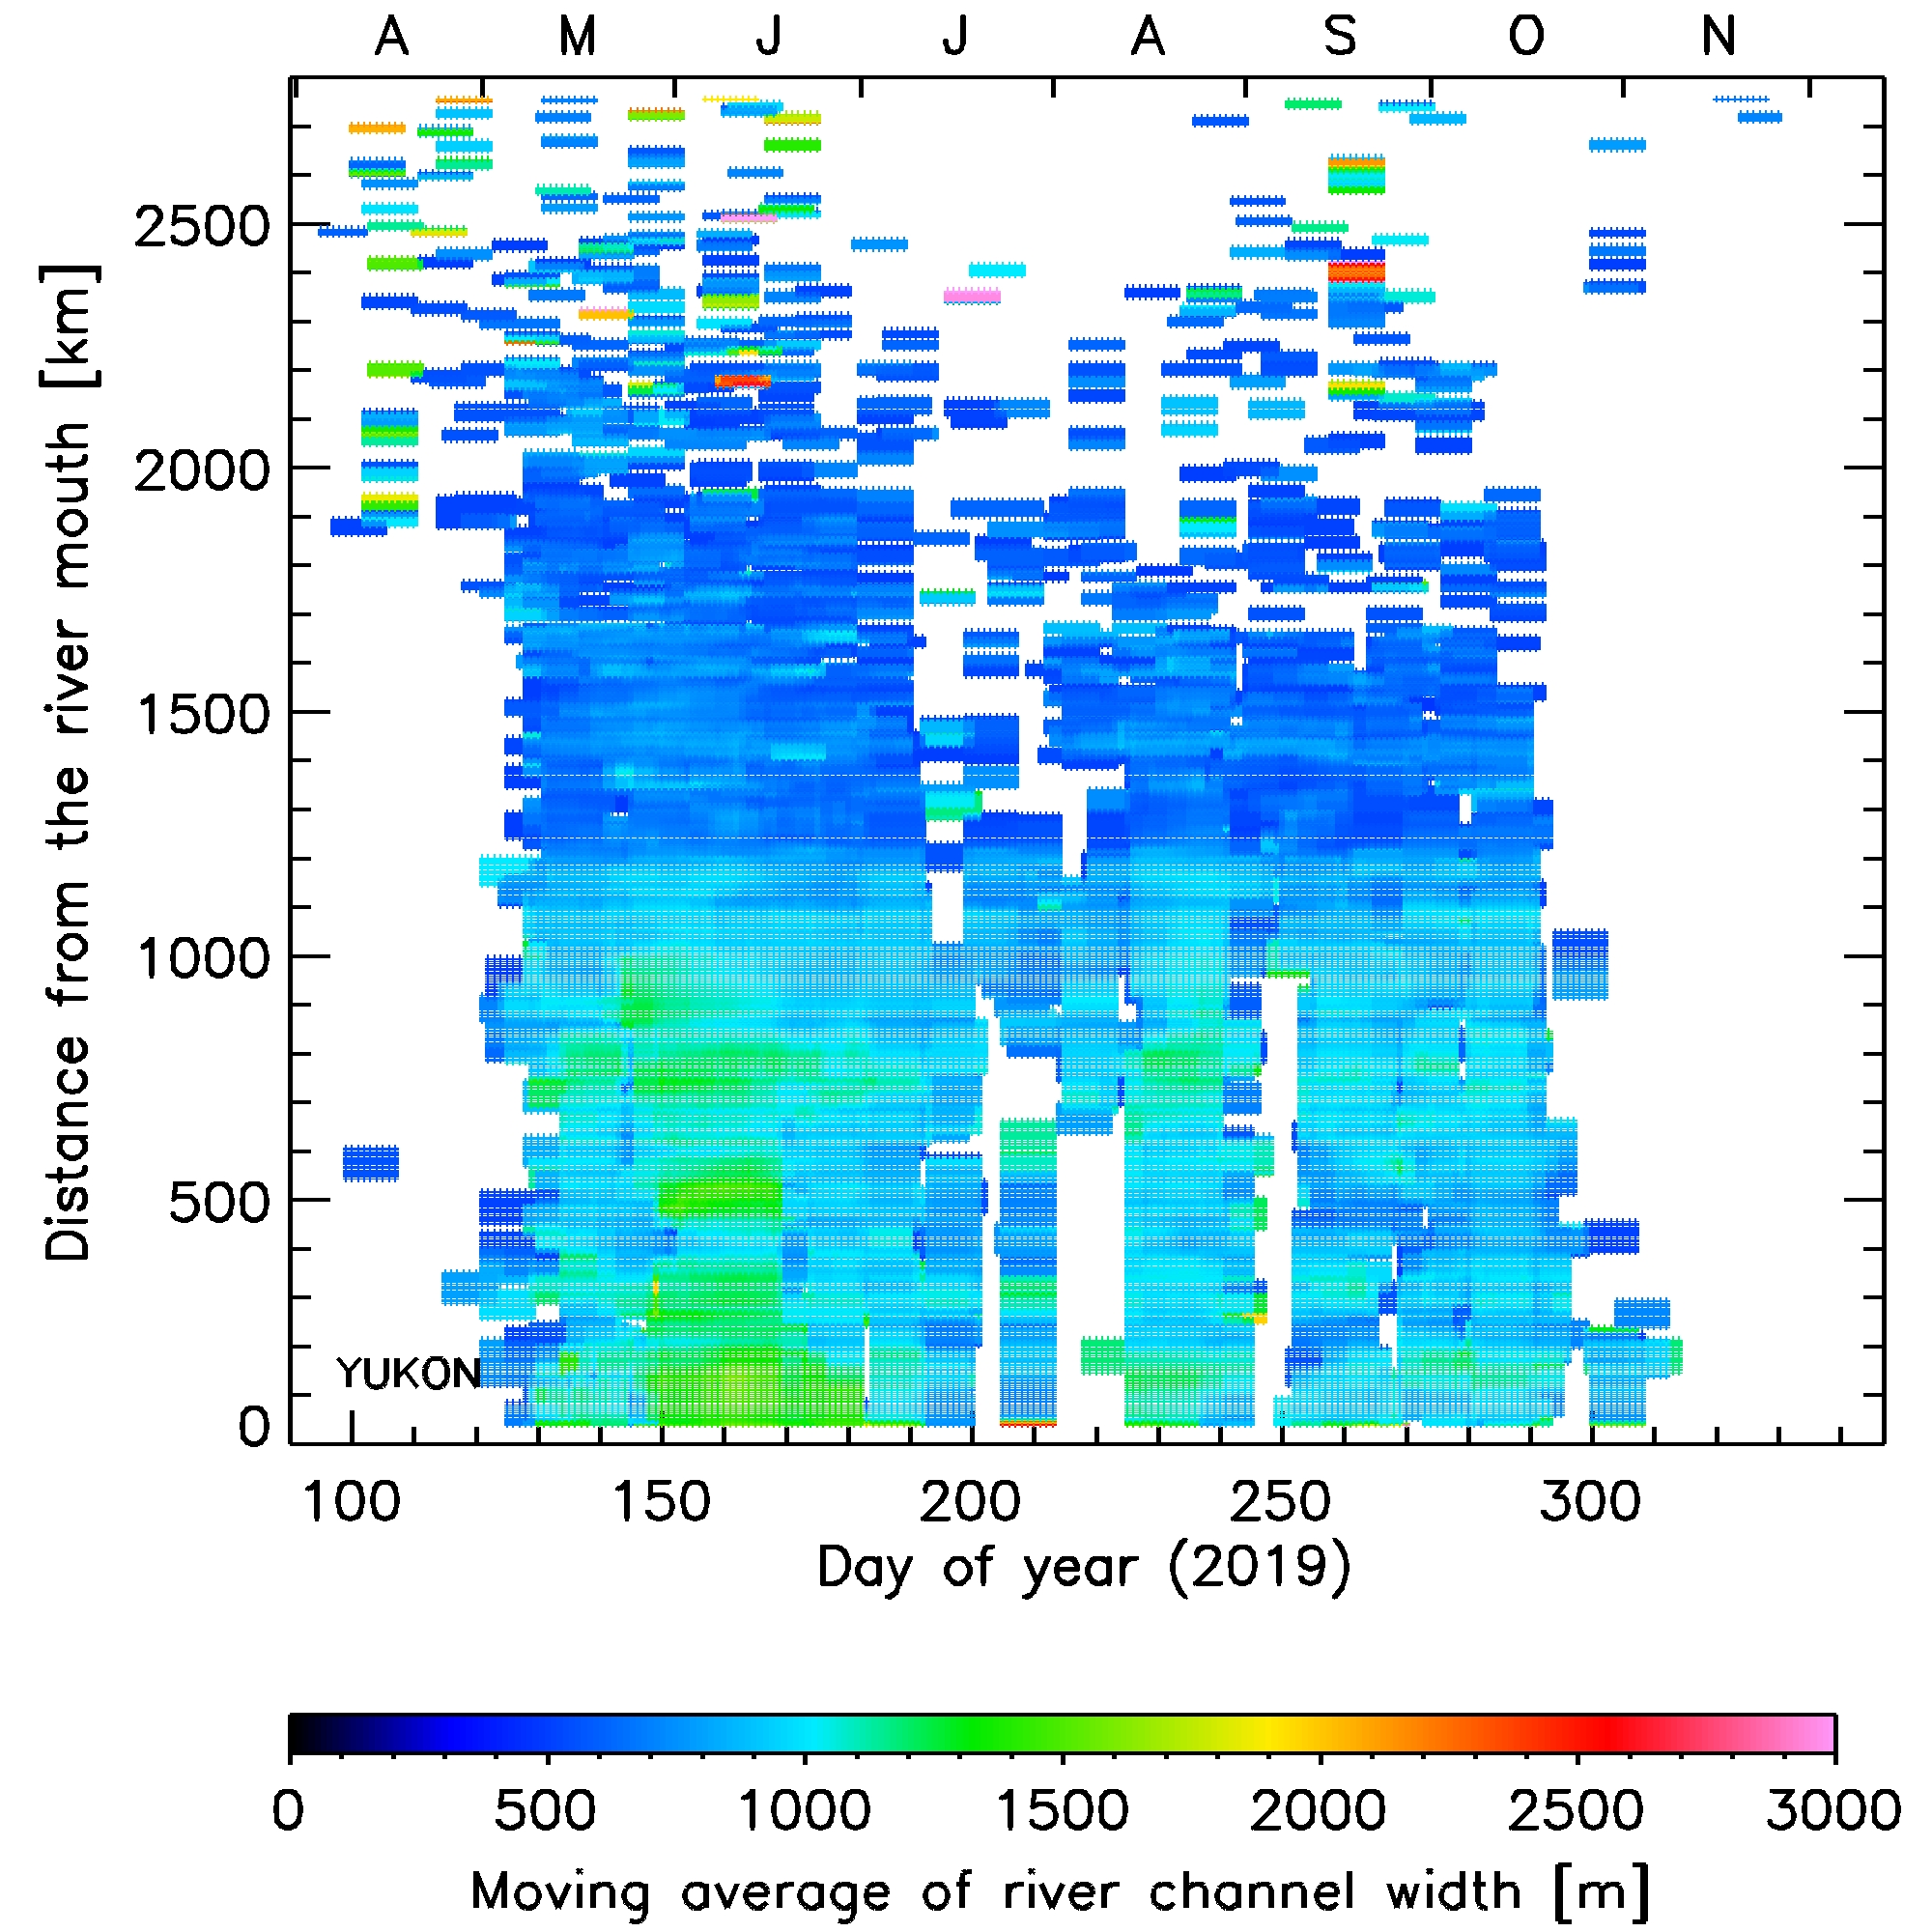
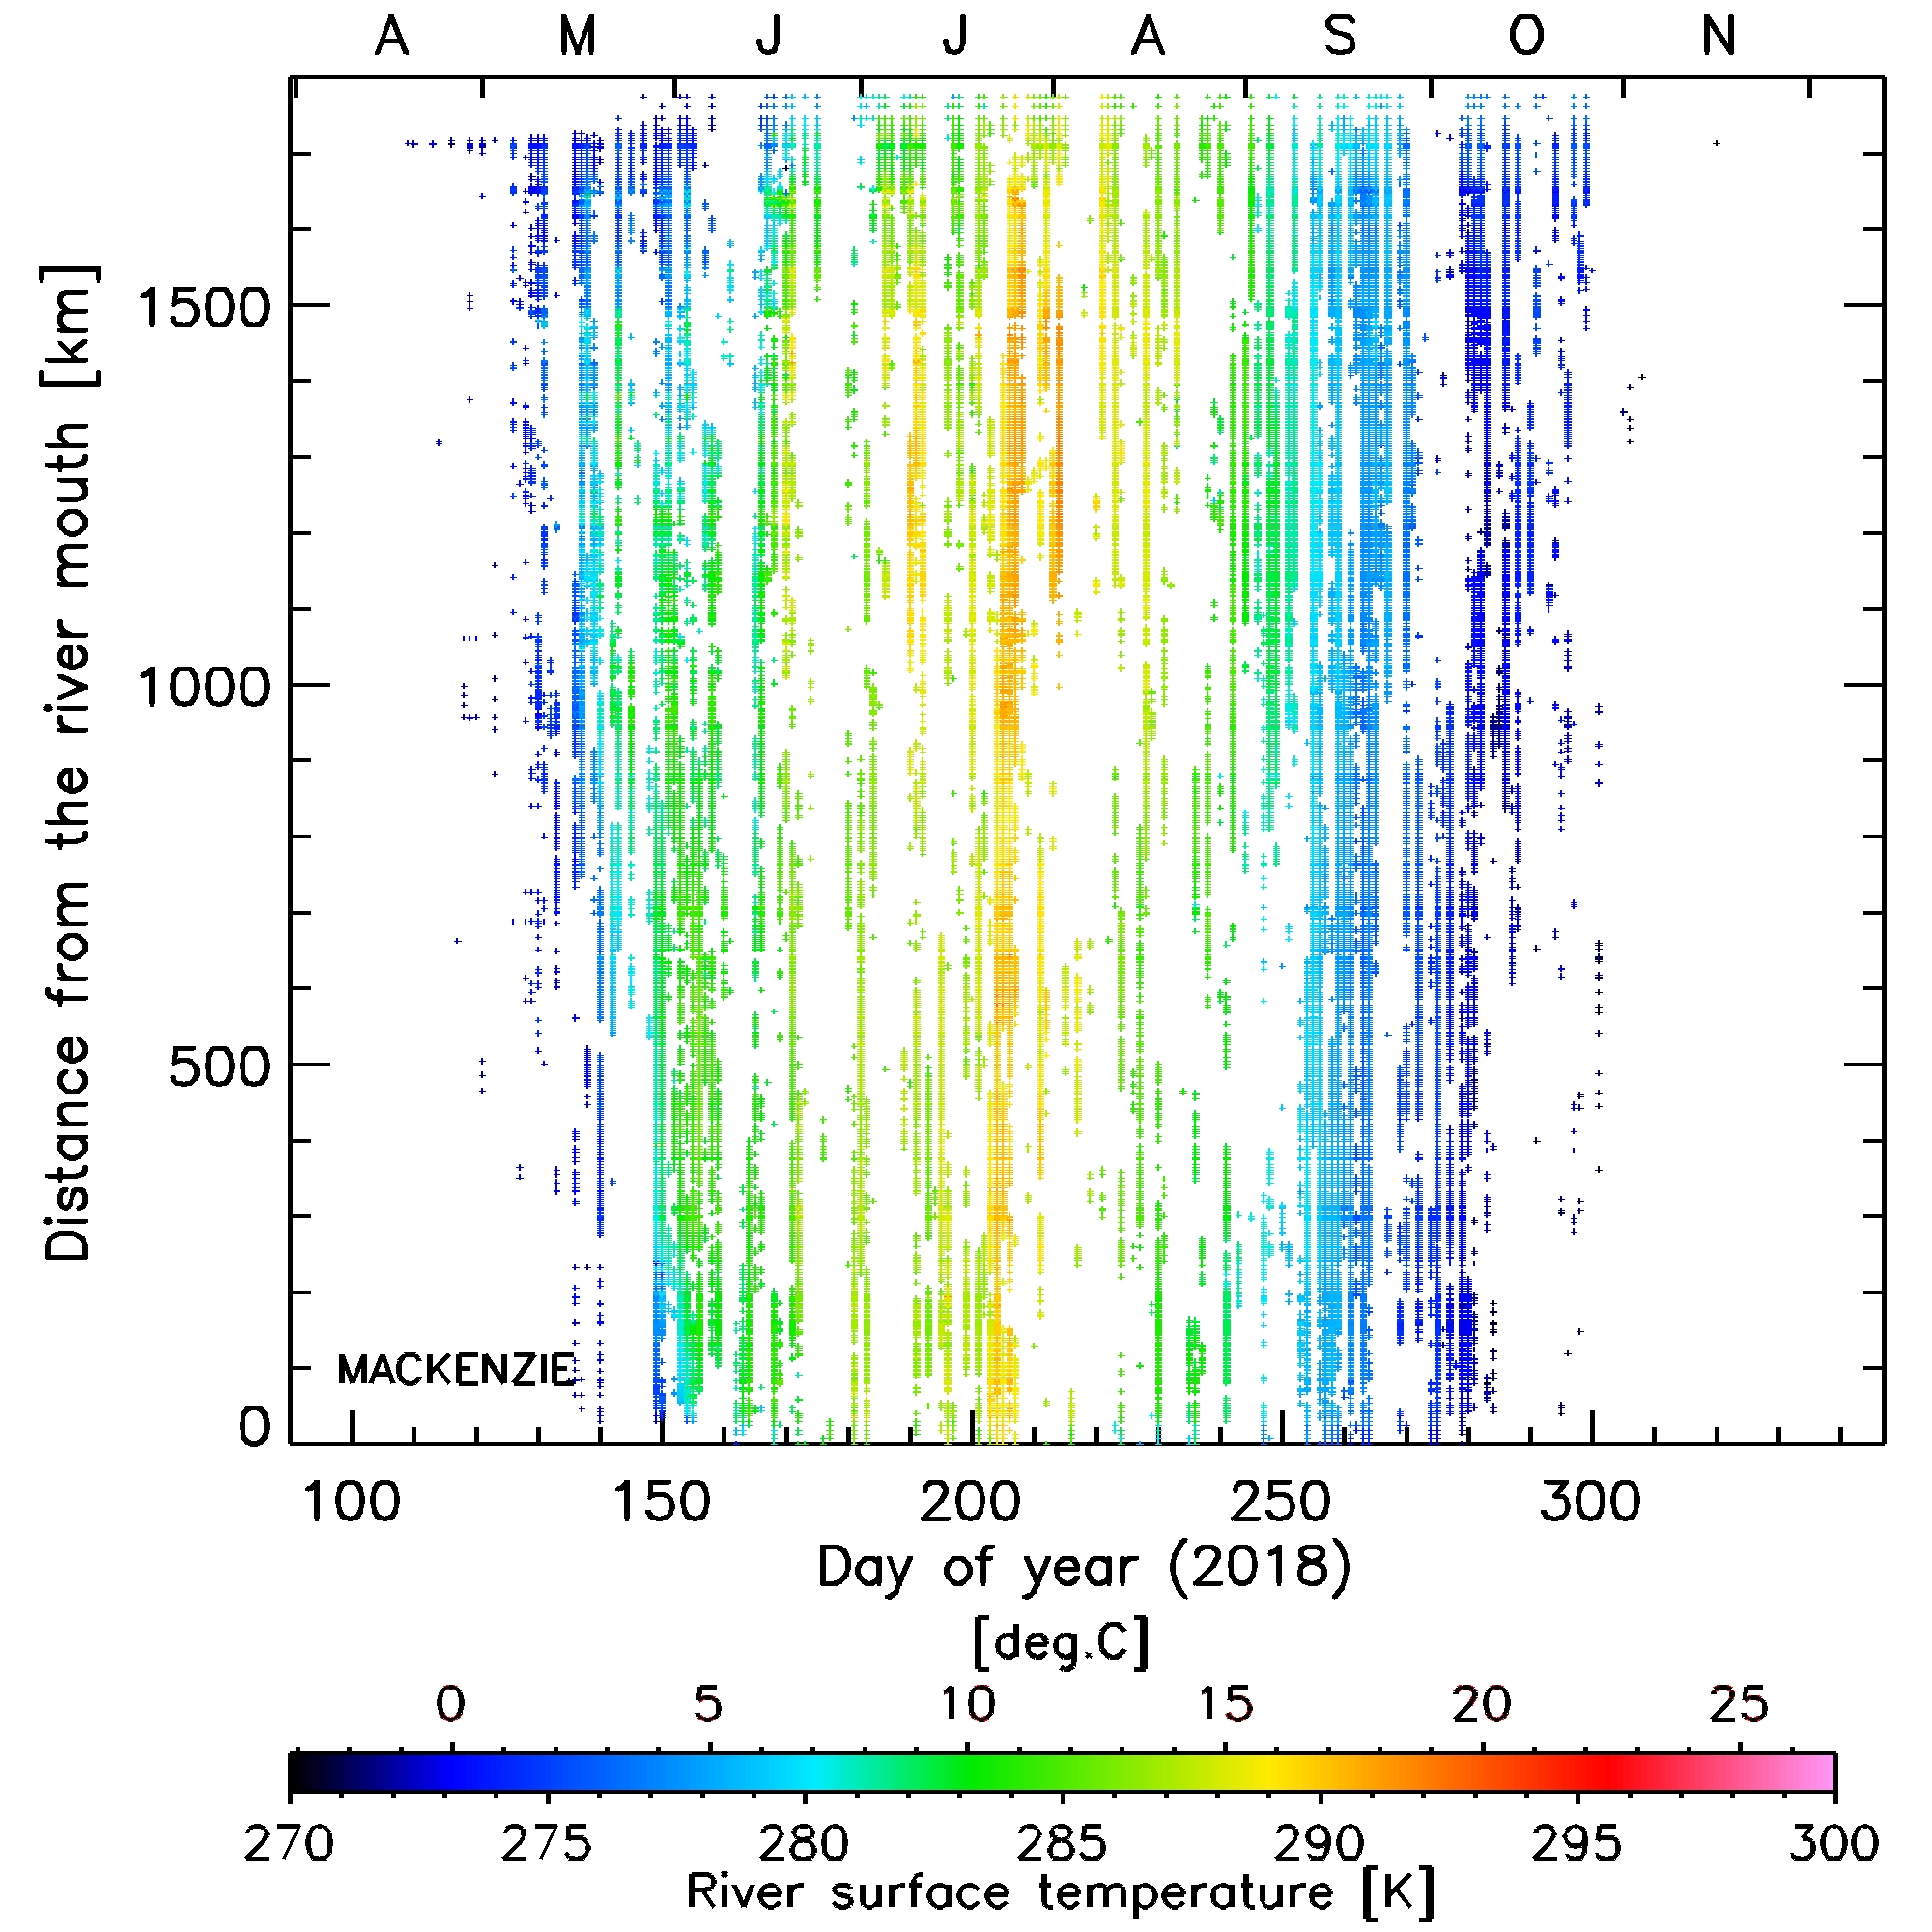
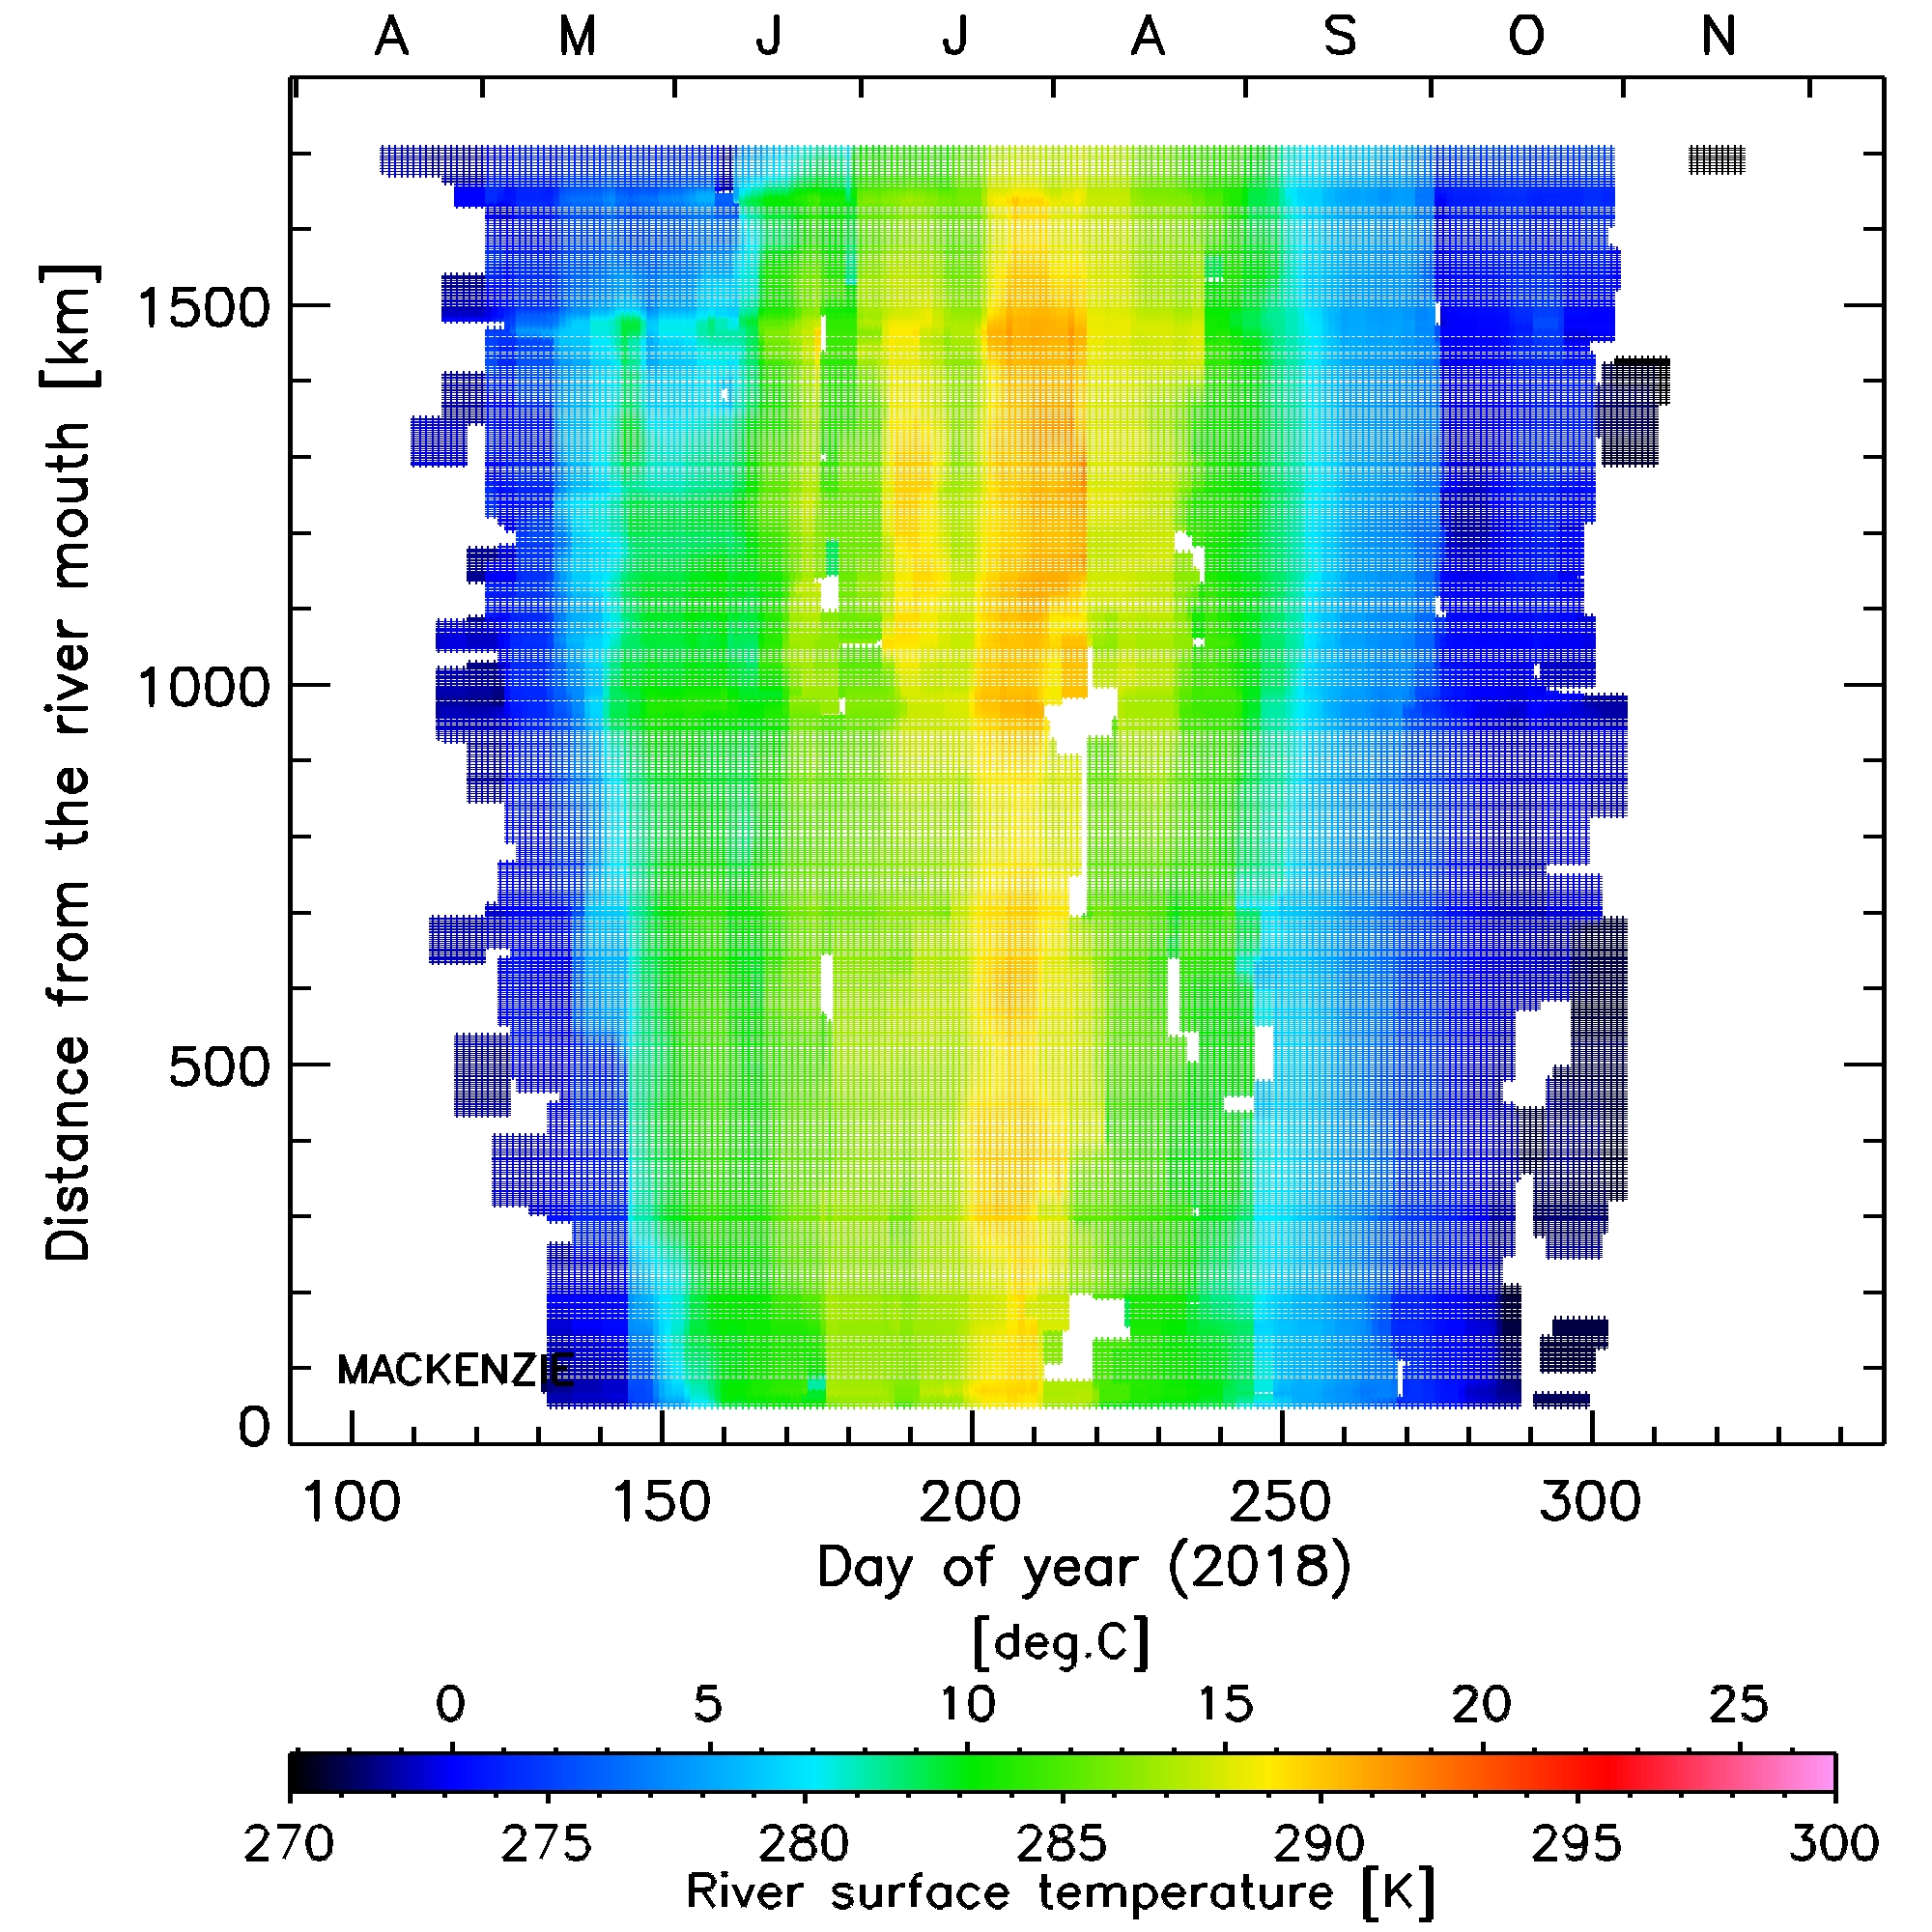
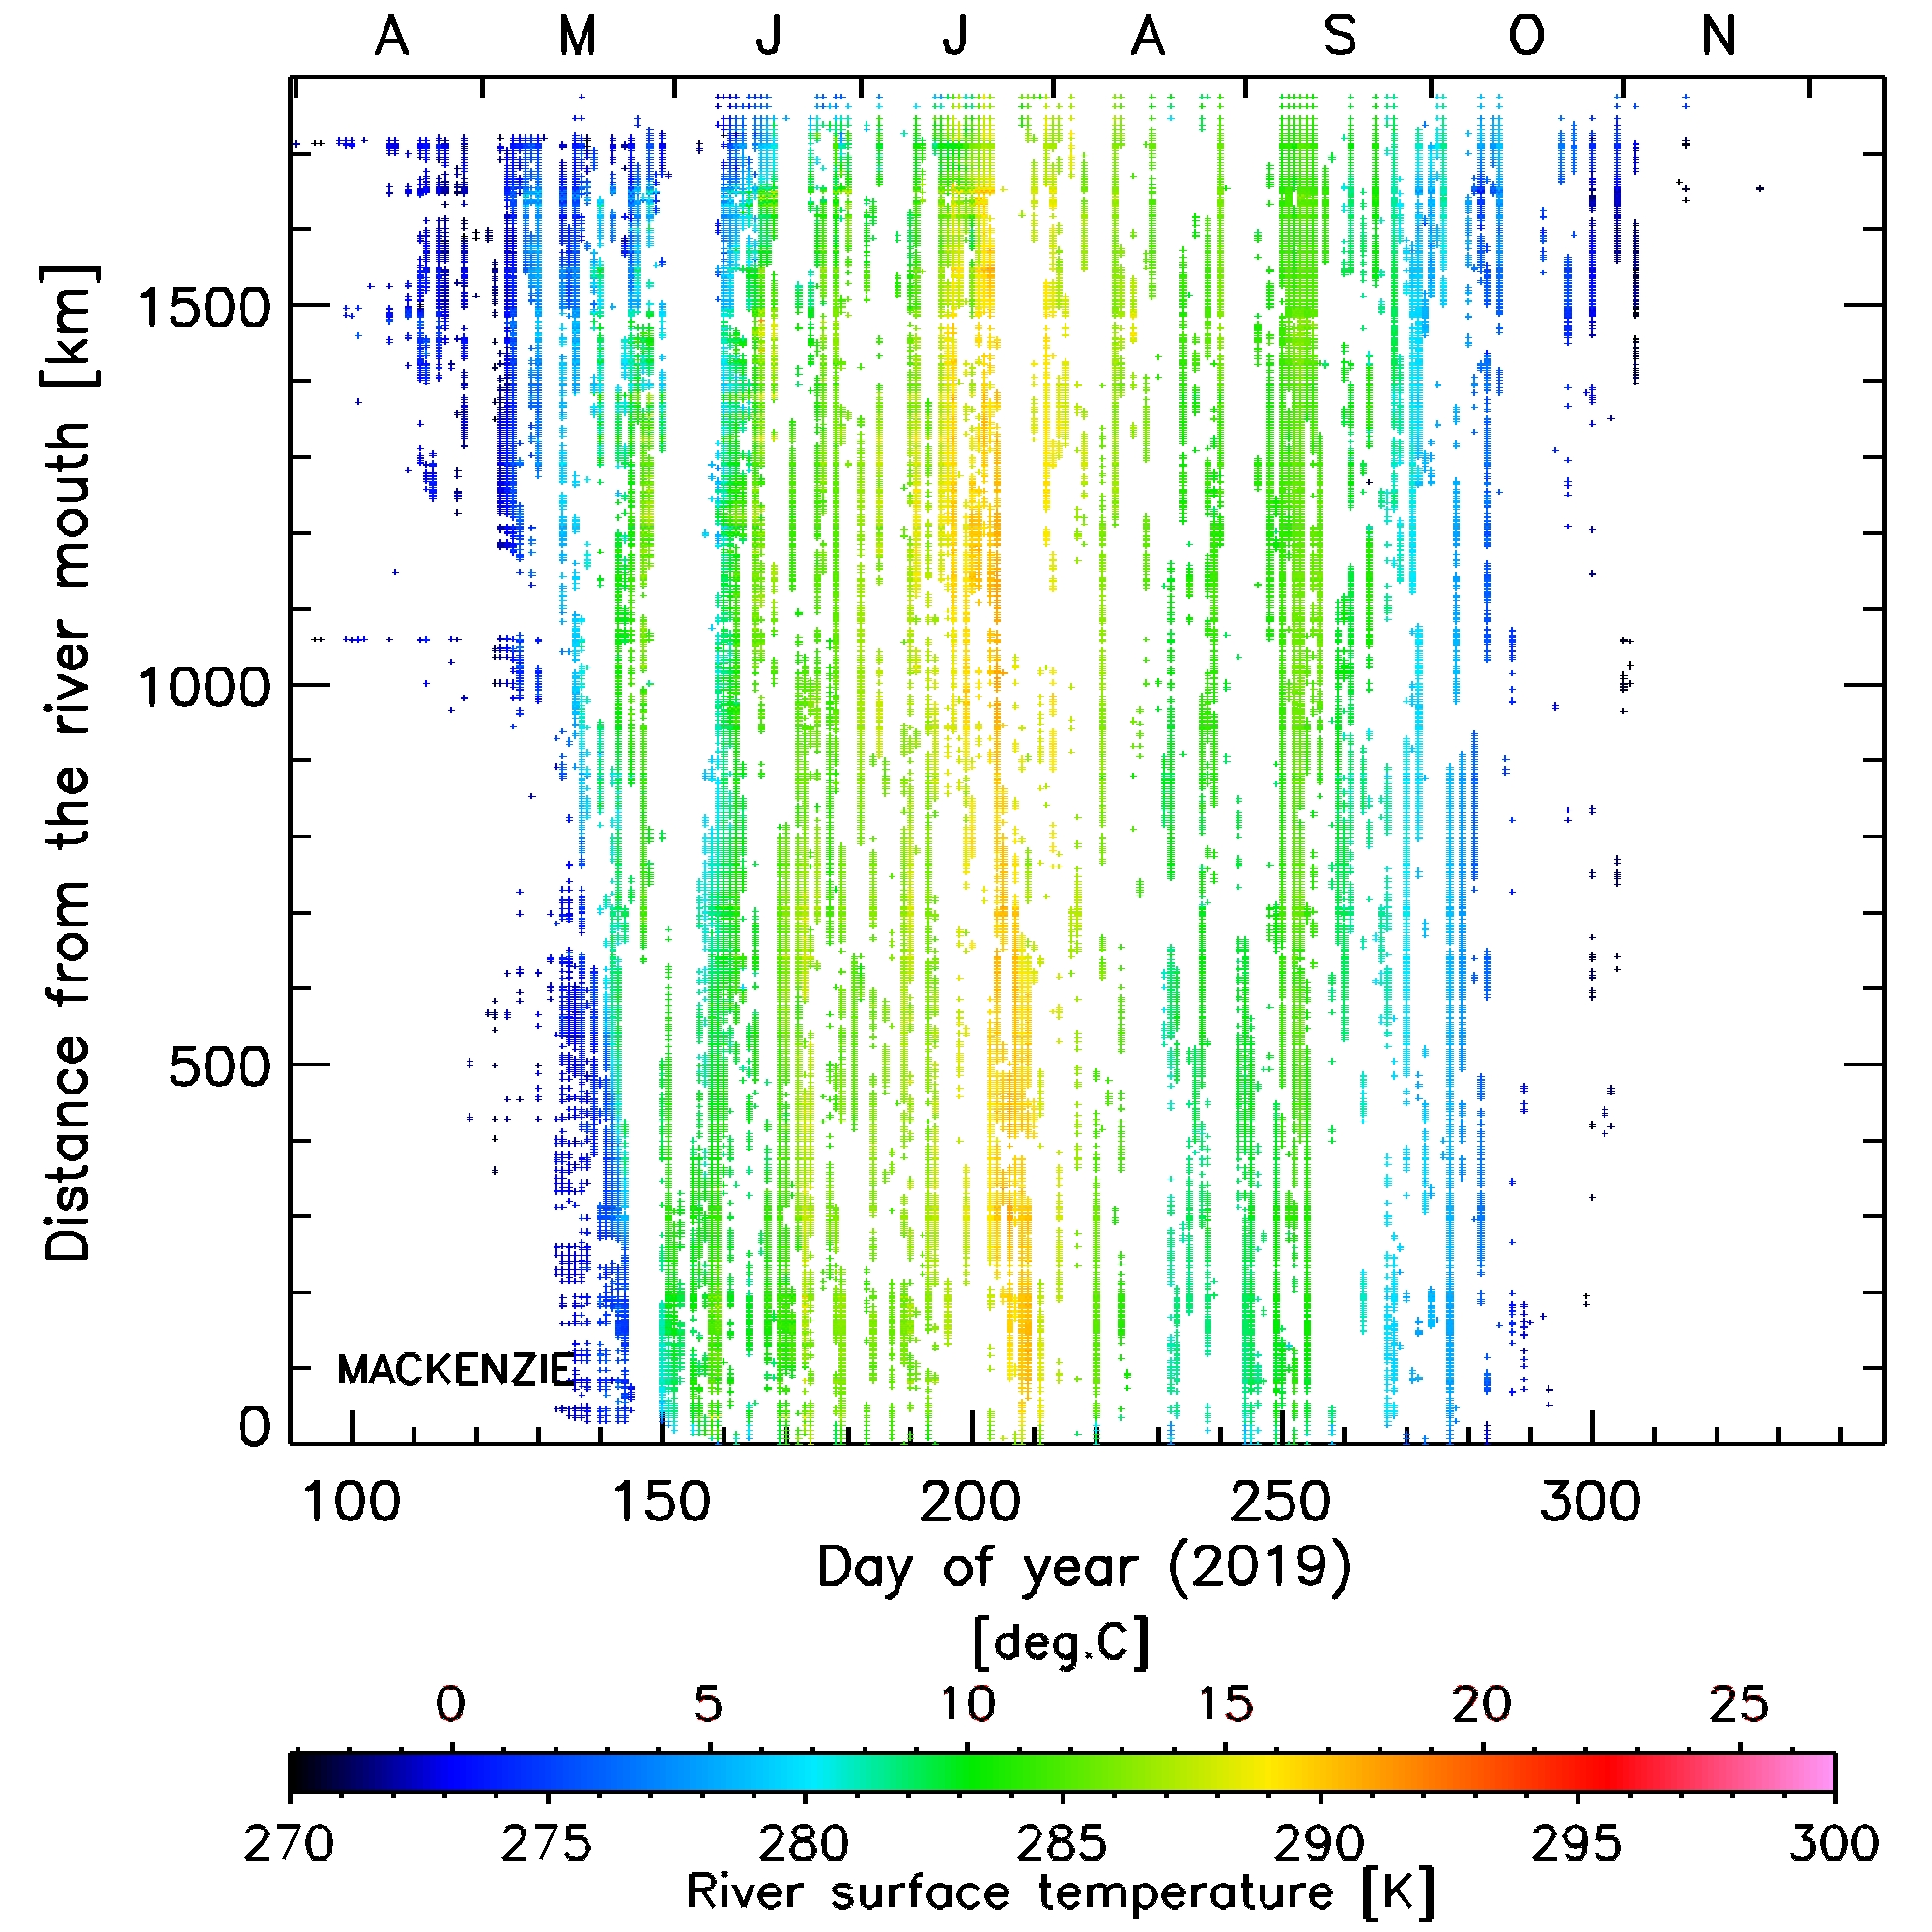
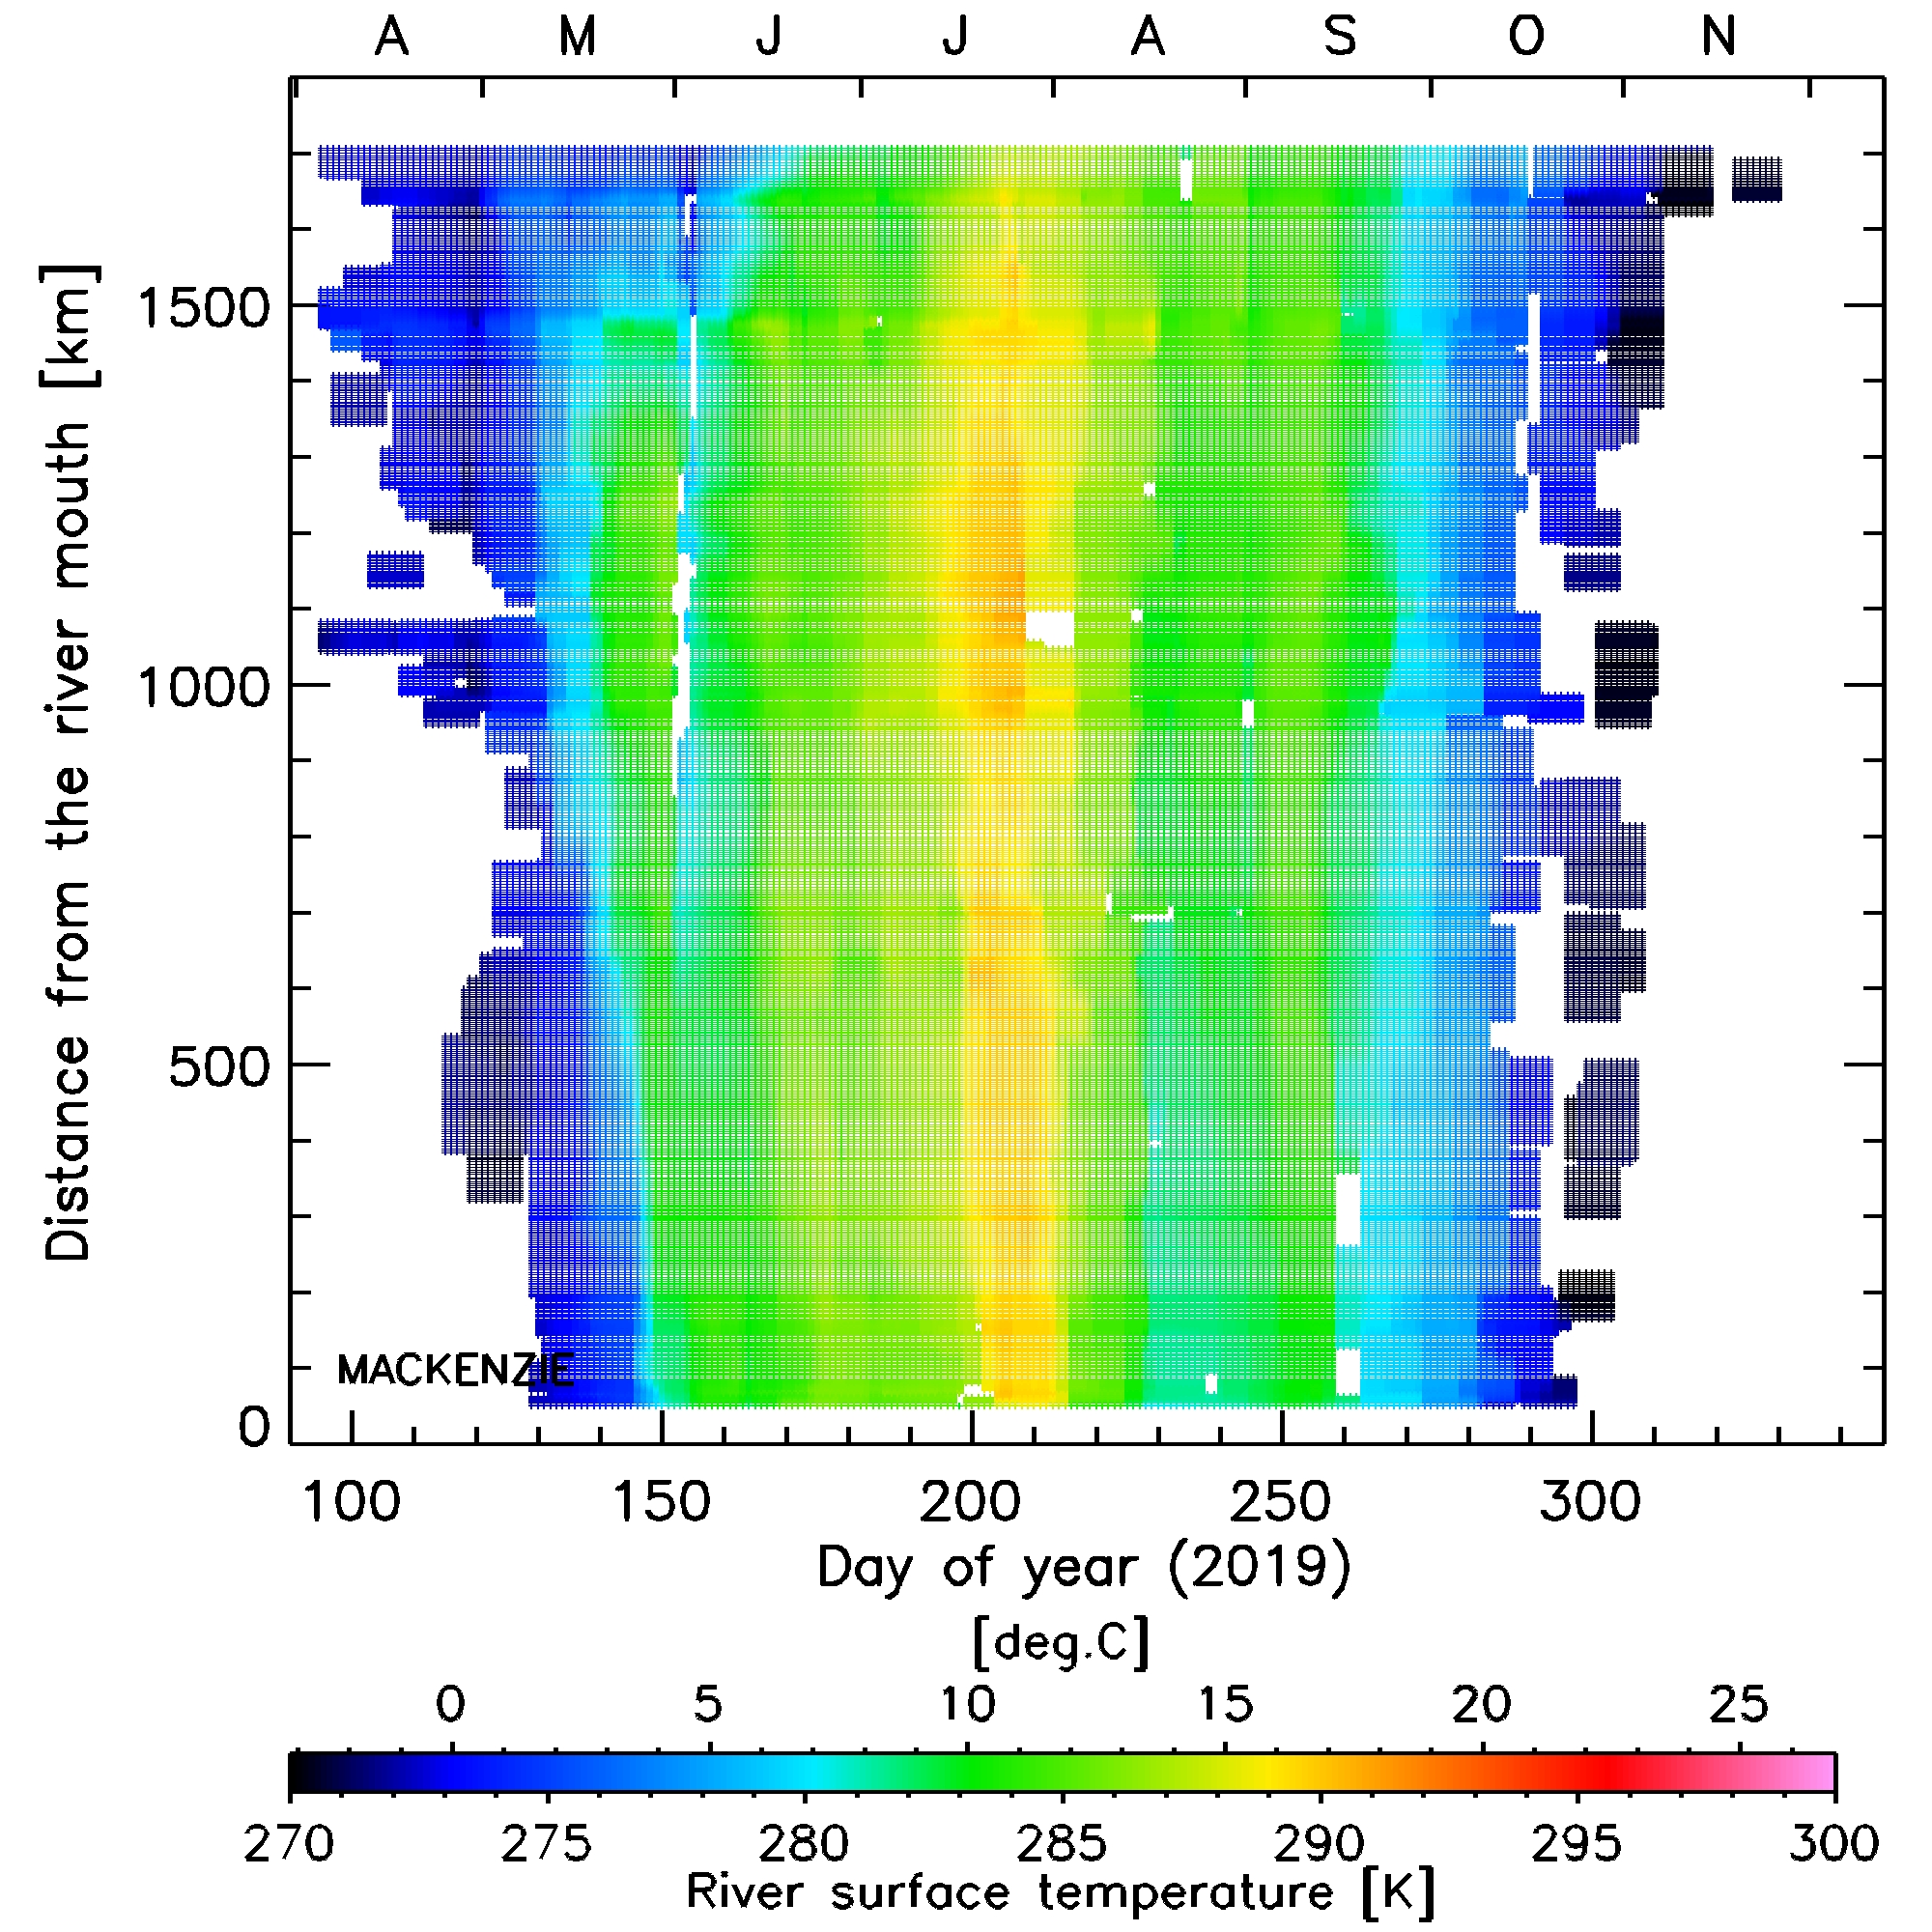
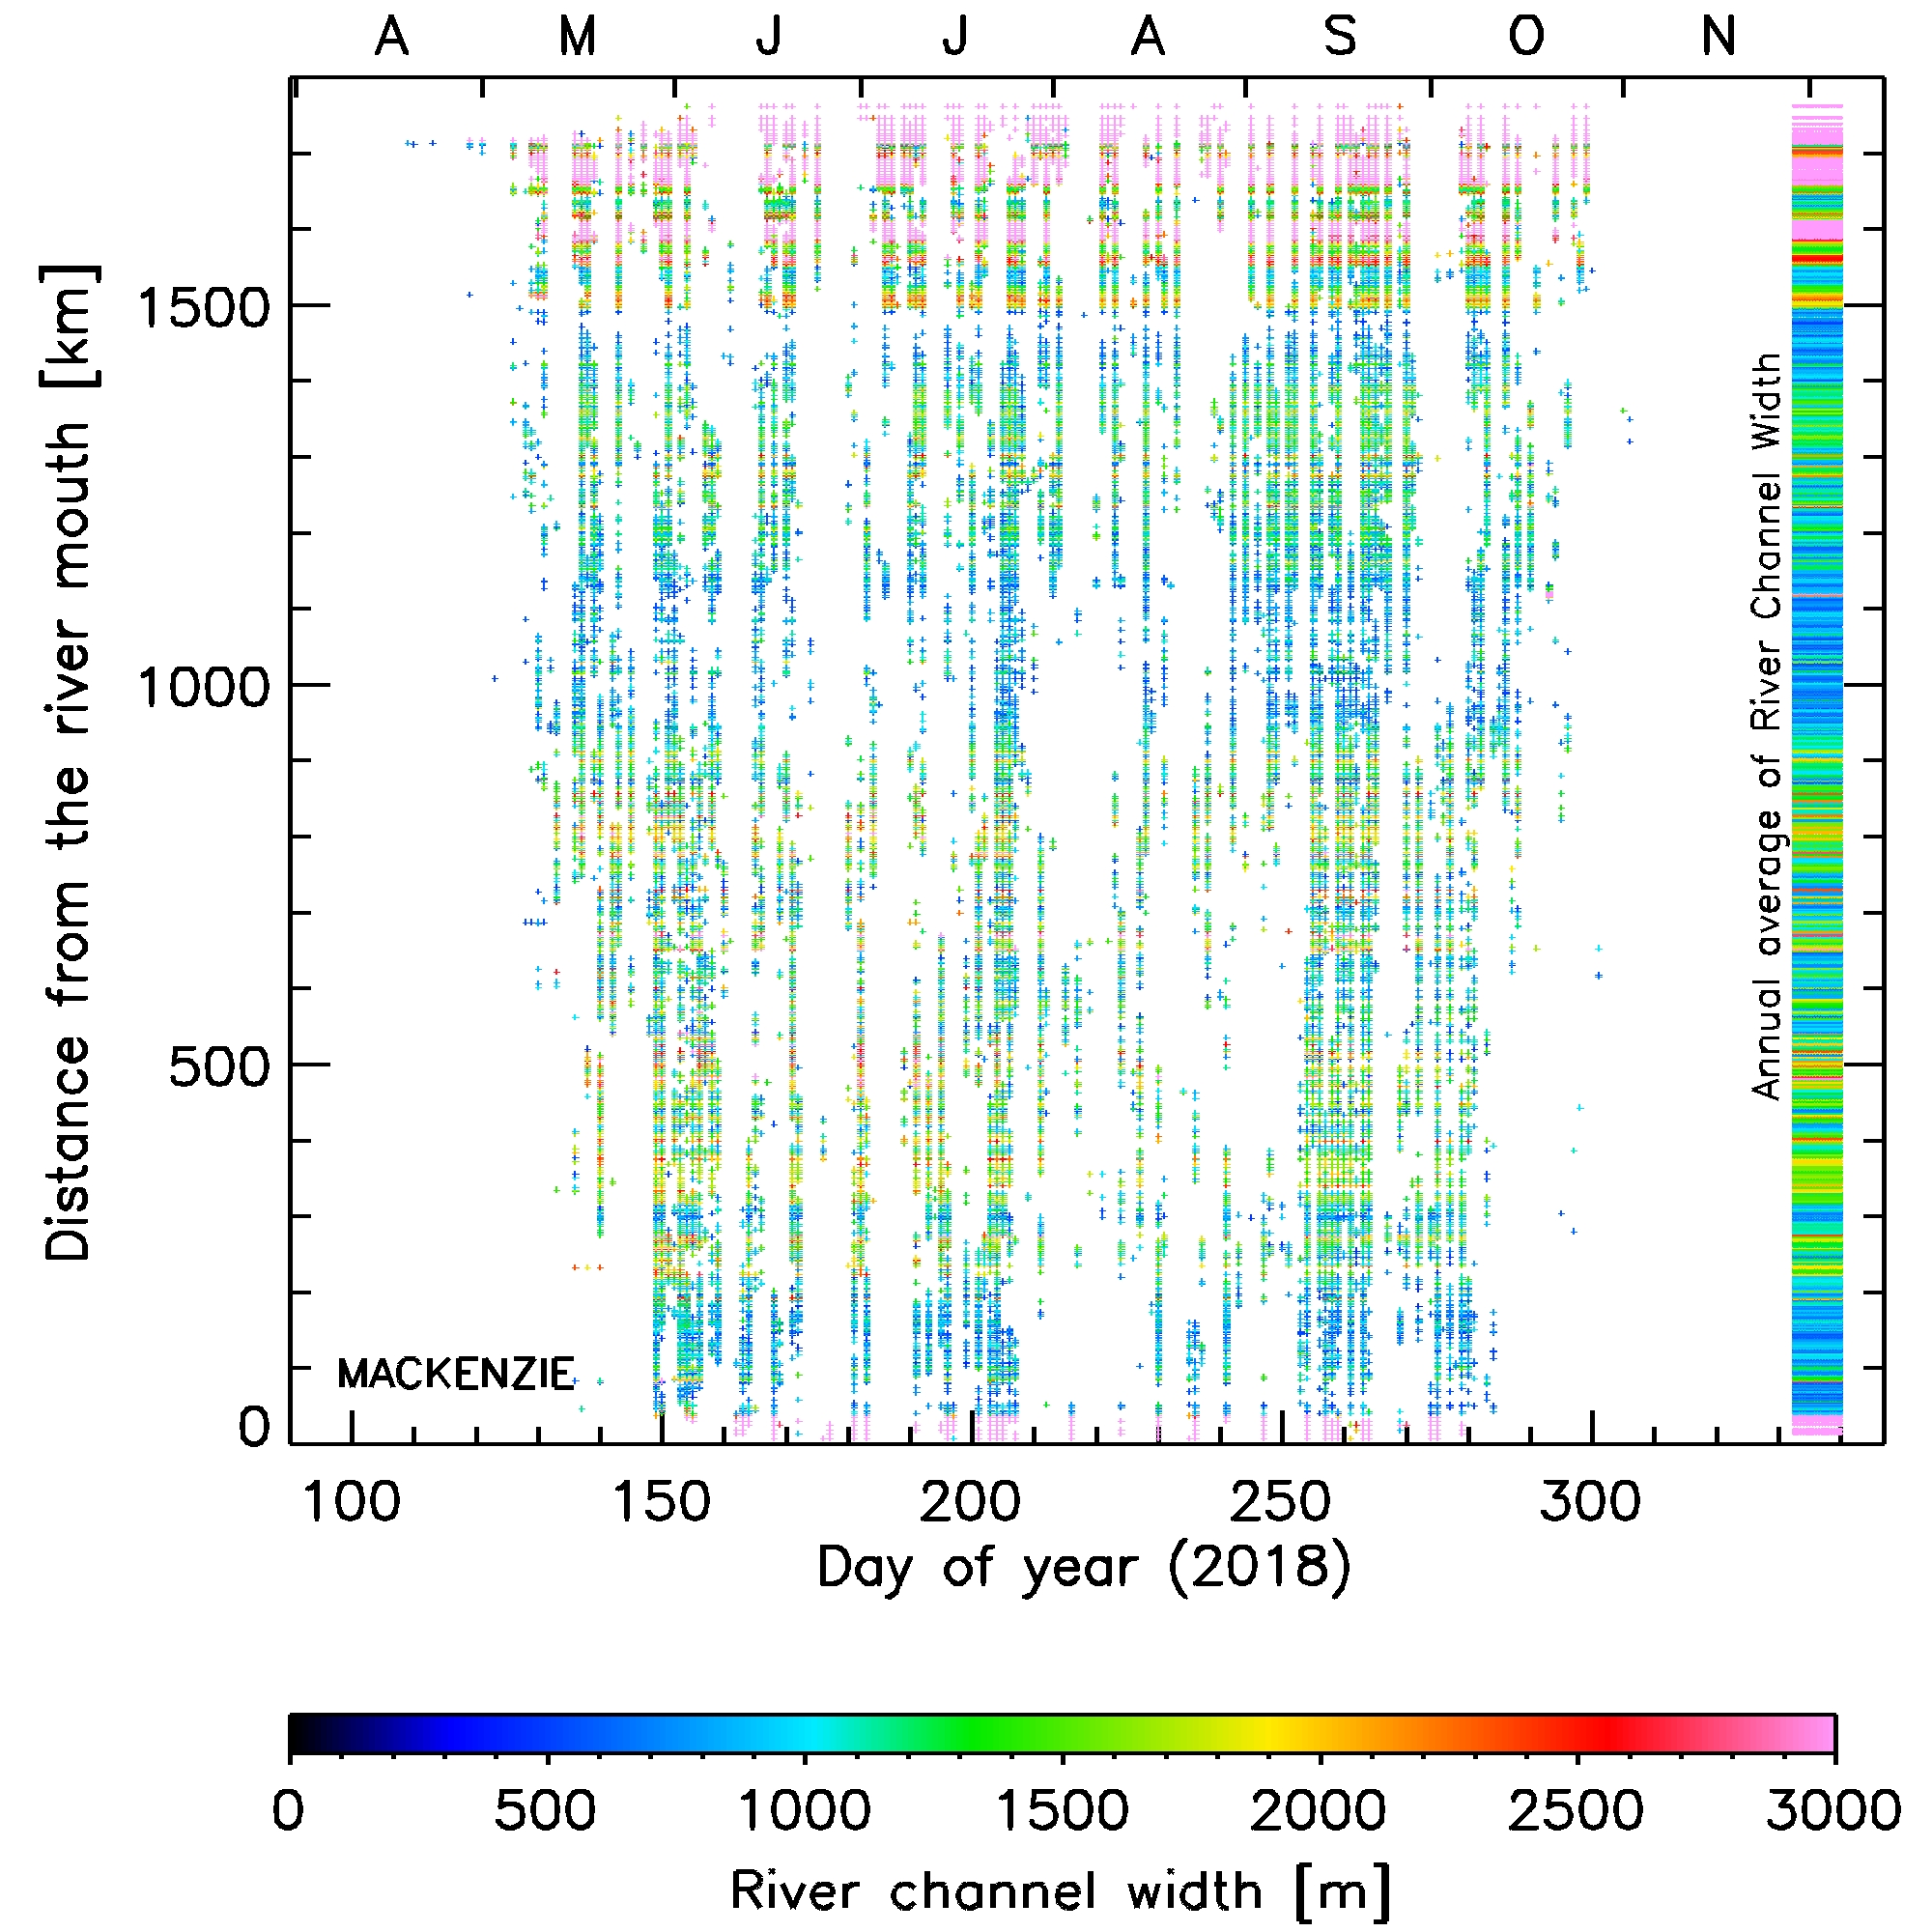
River Surface Temperature (RST) / Channel Width (RCW) in the Arctic Regions
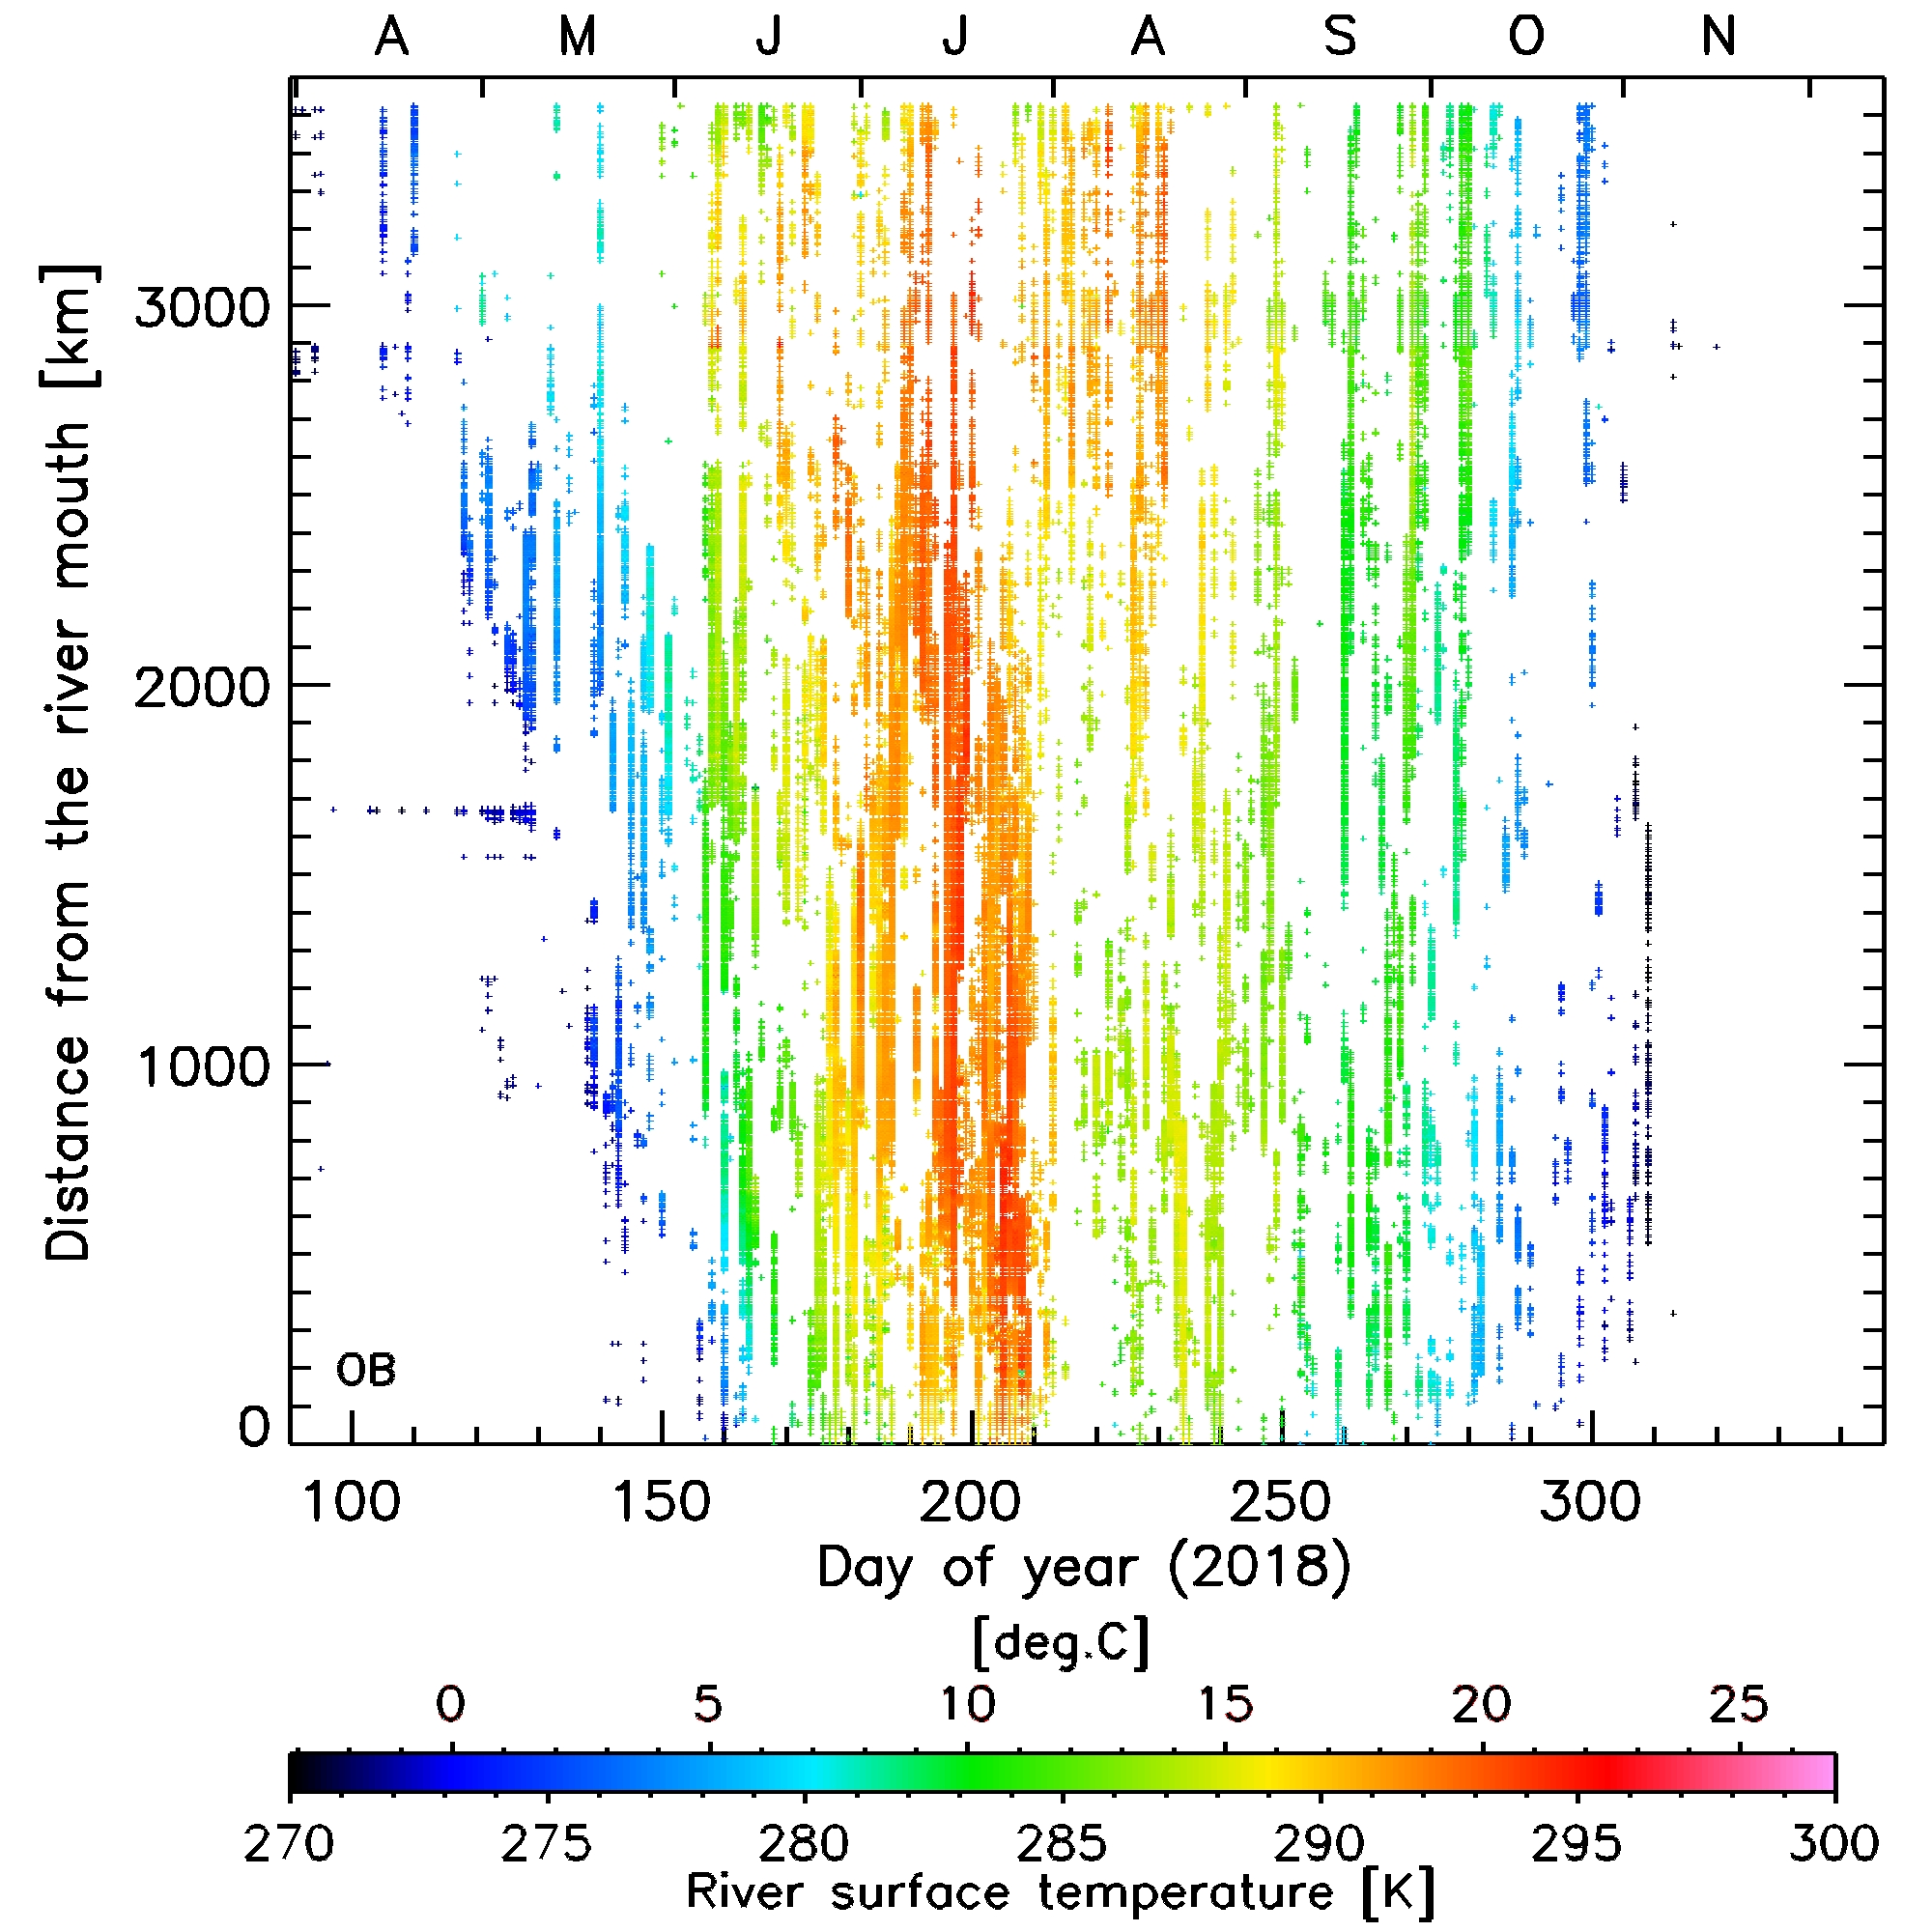
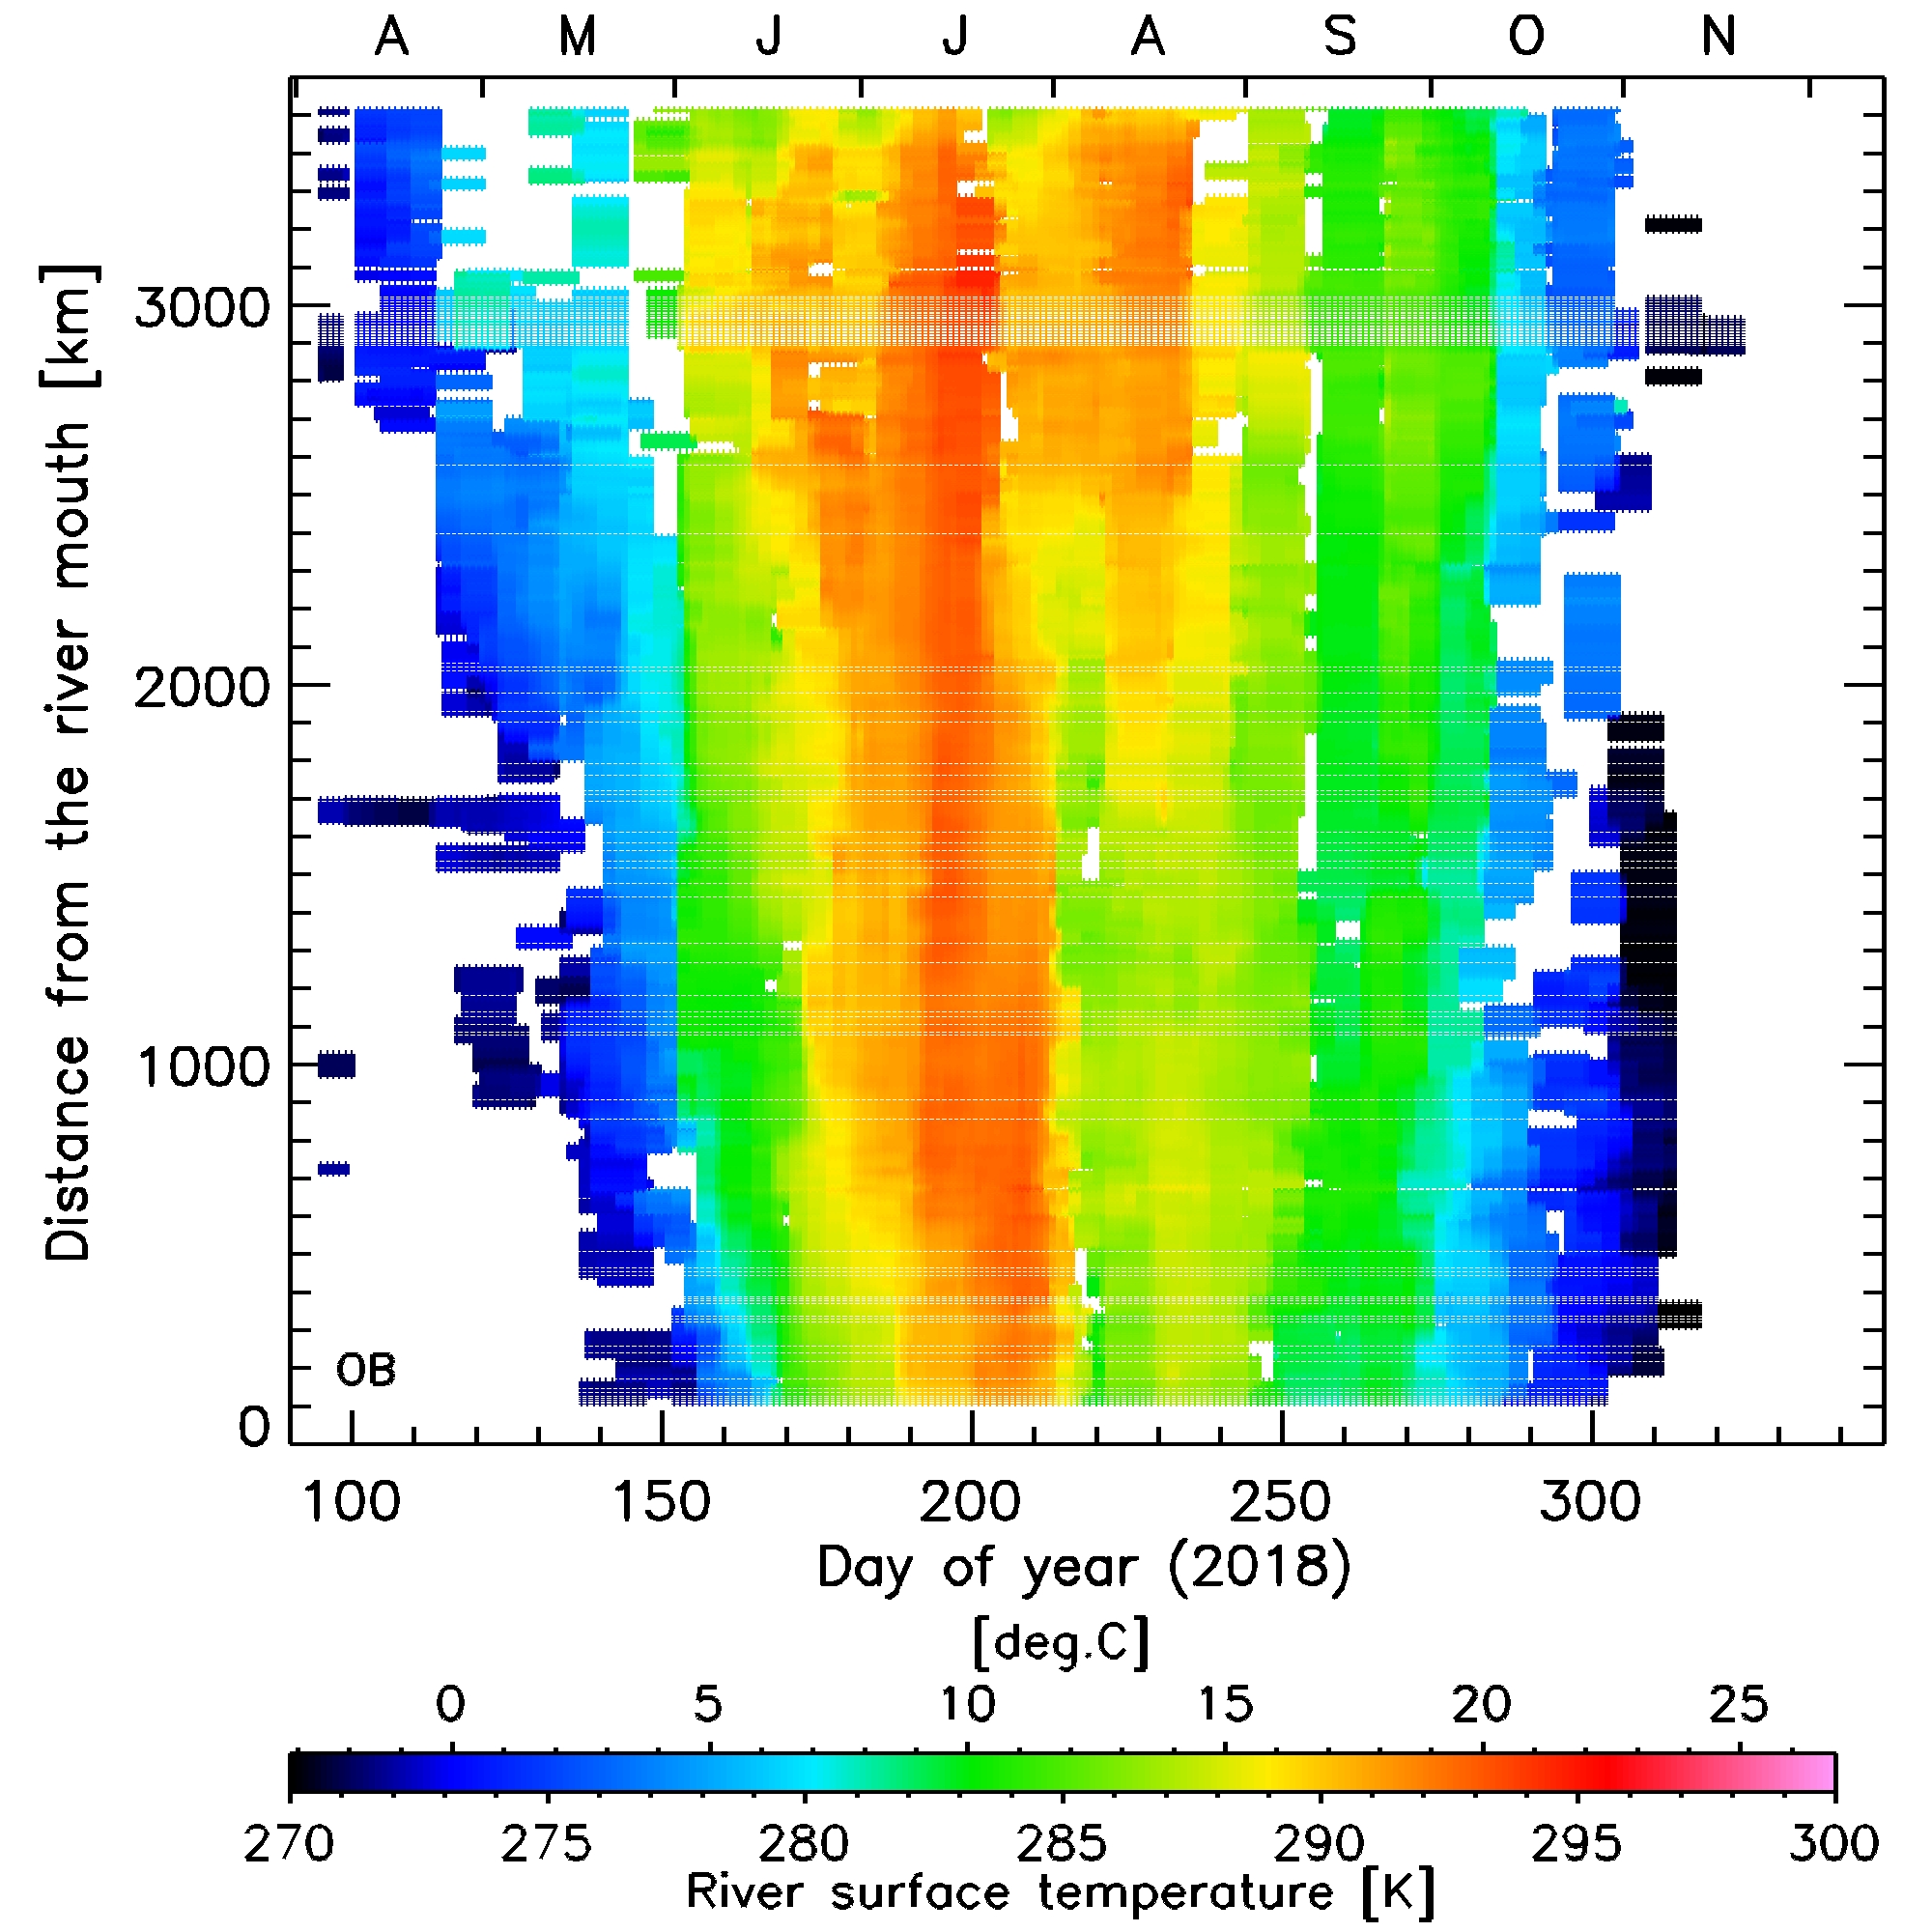
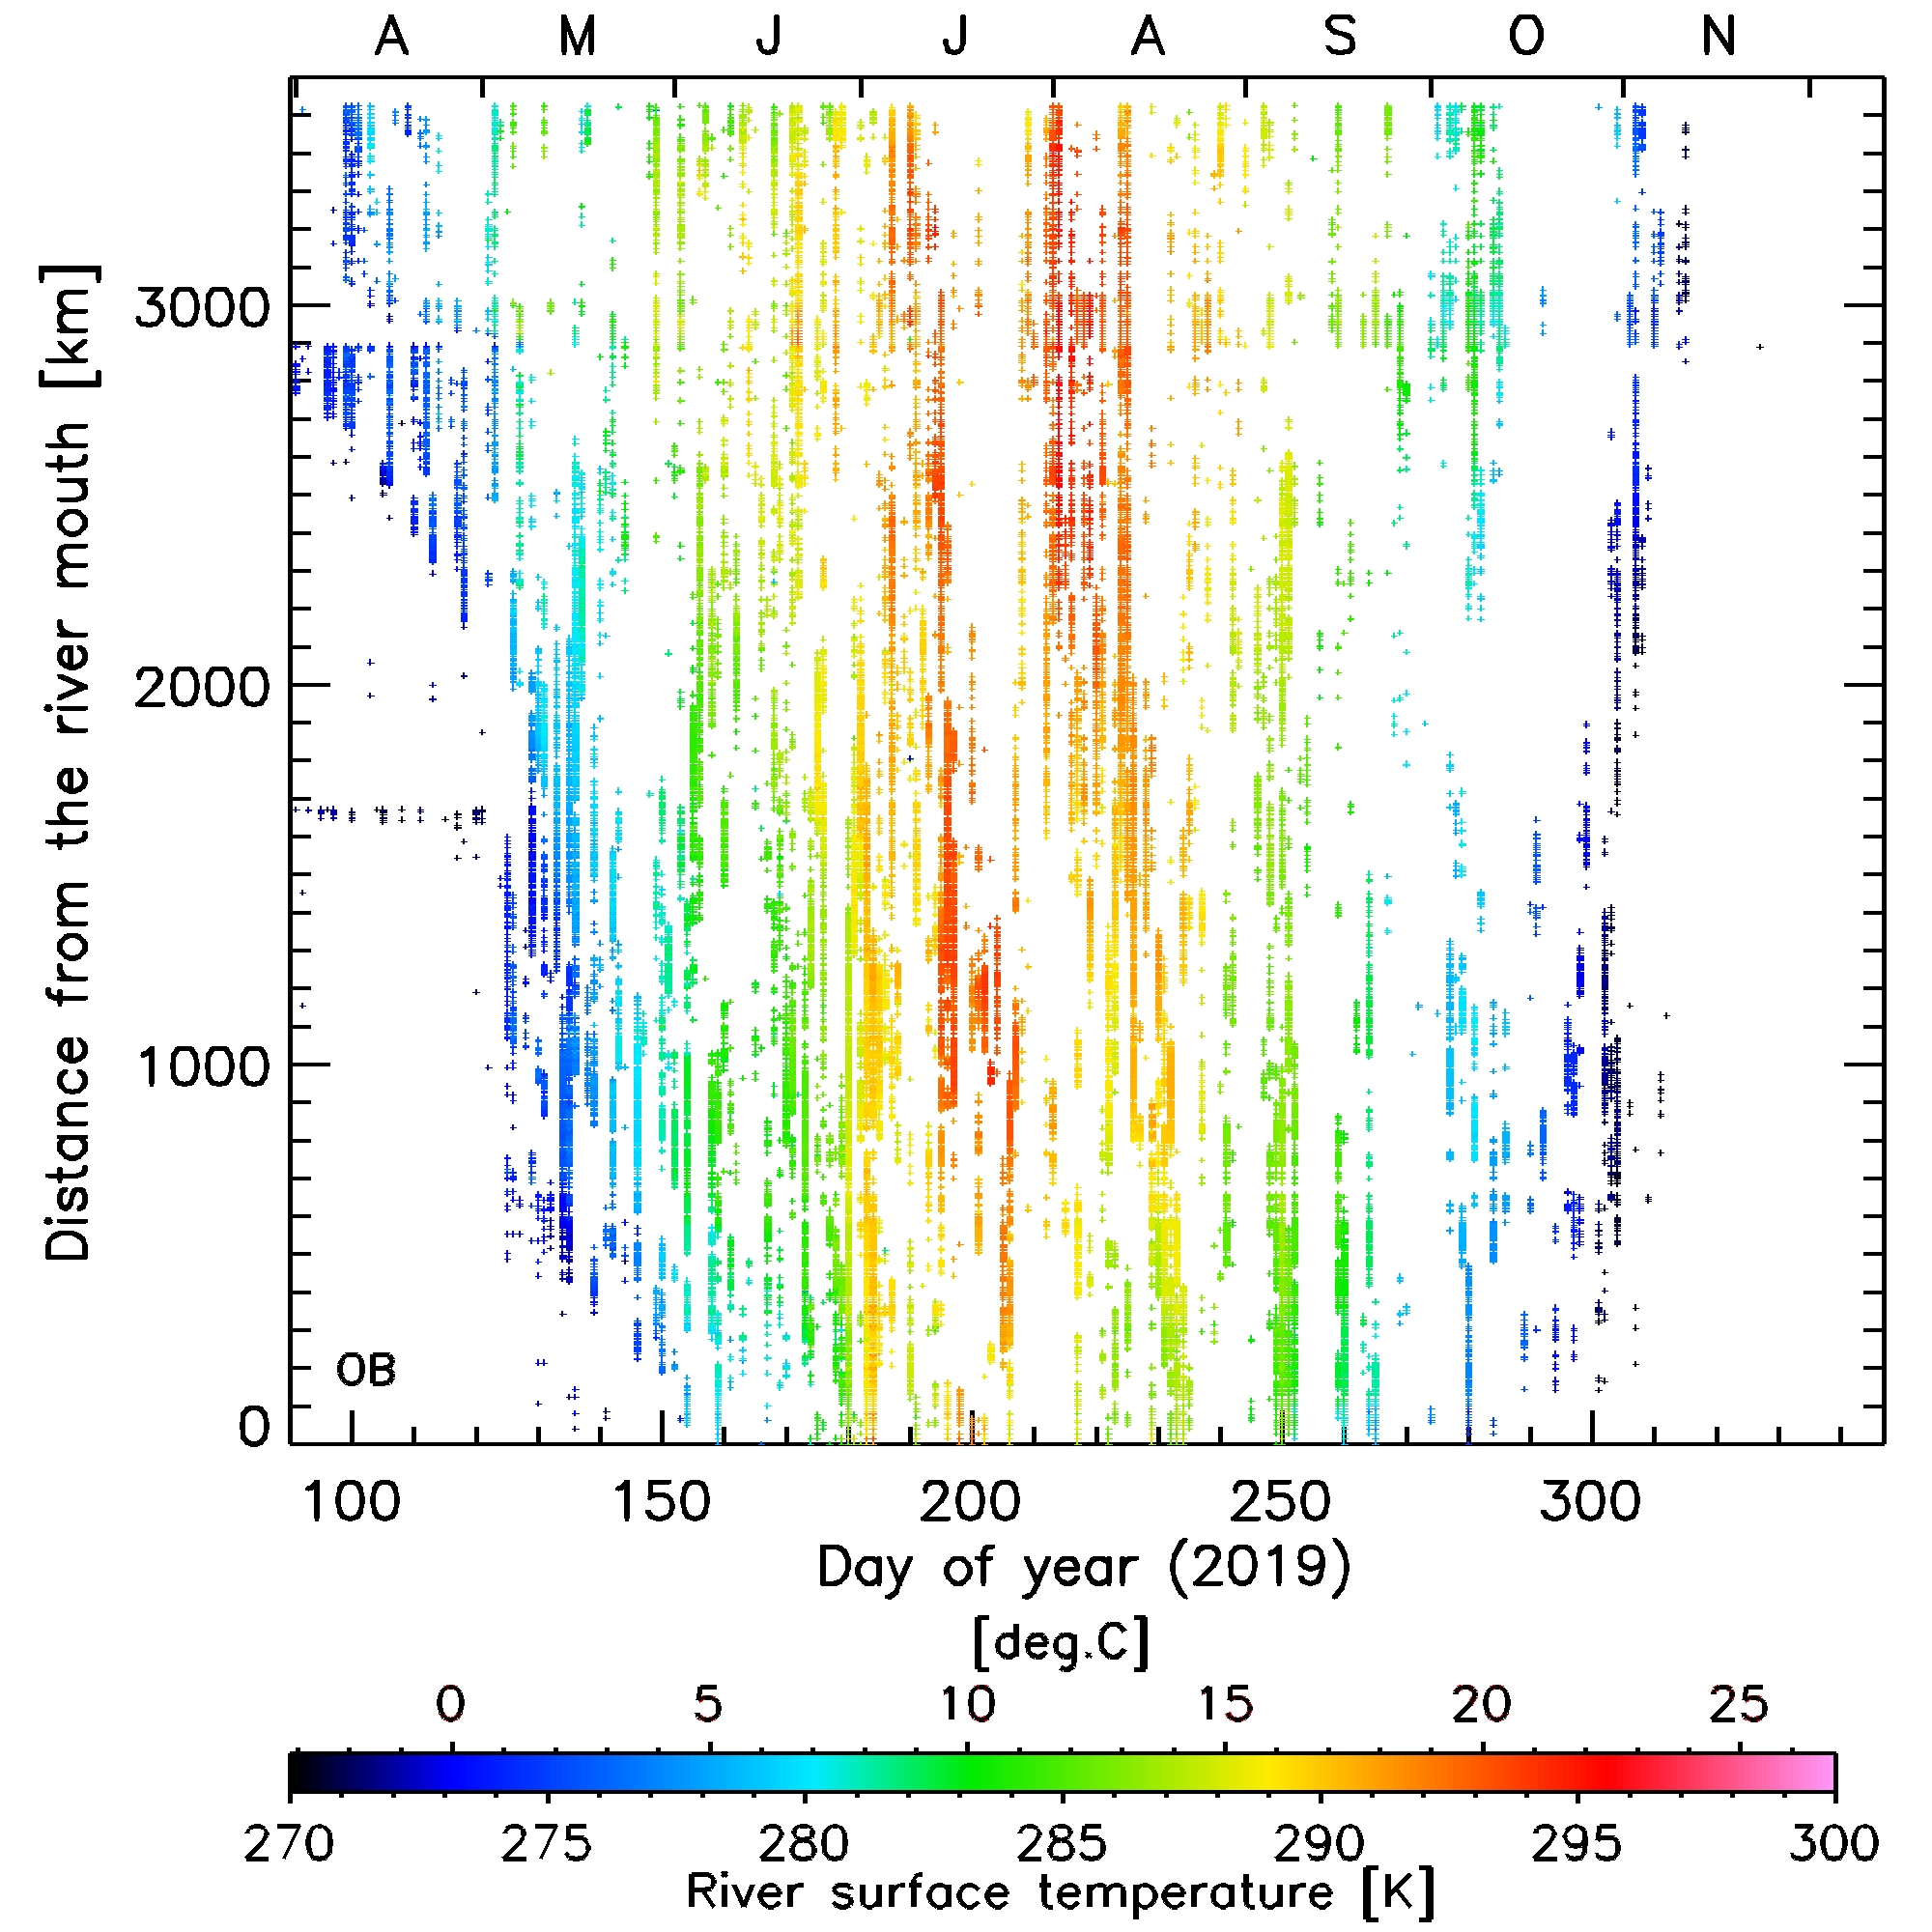
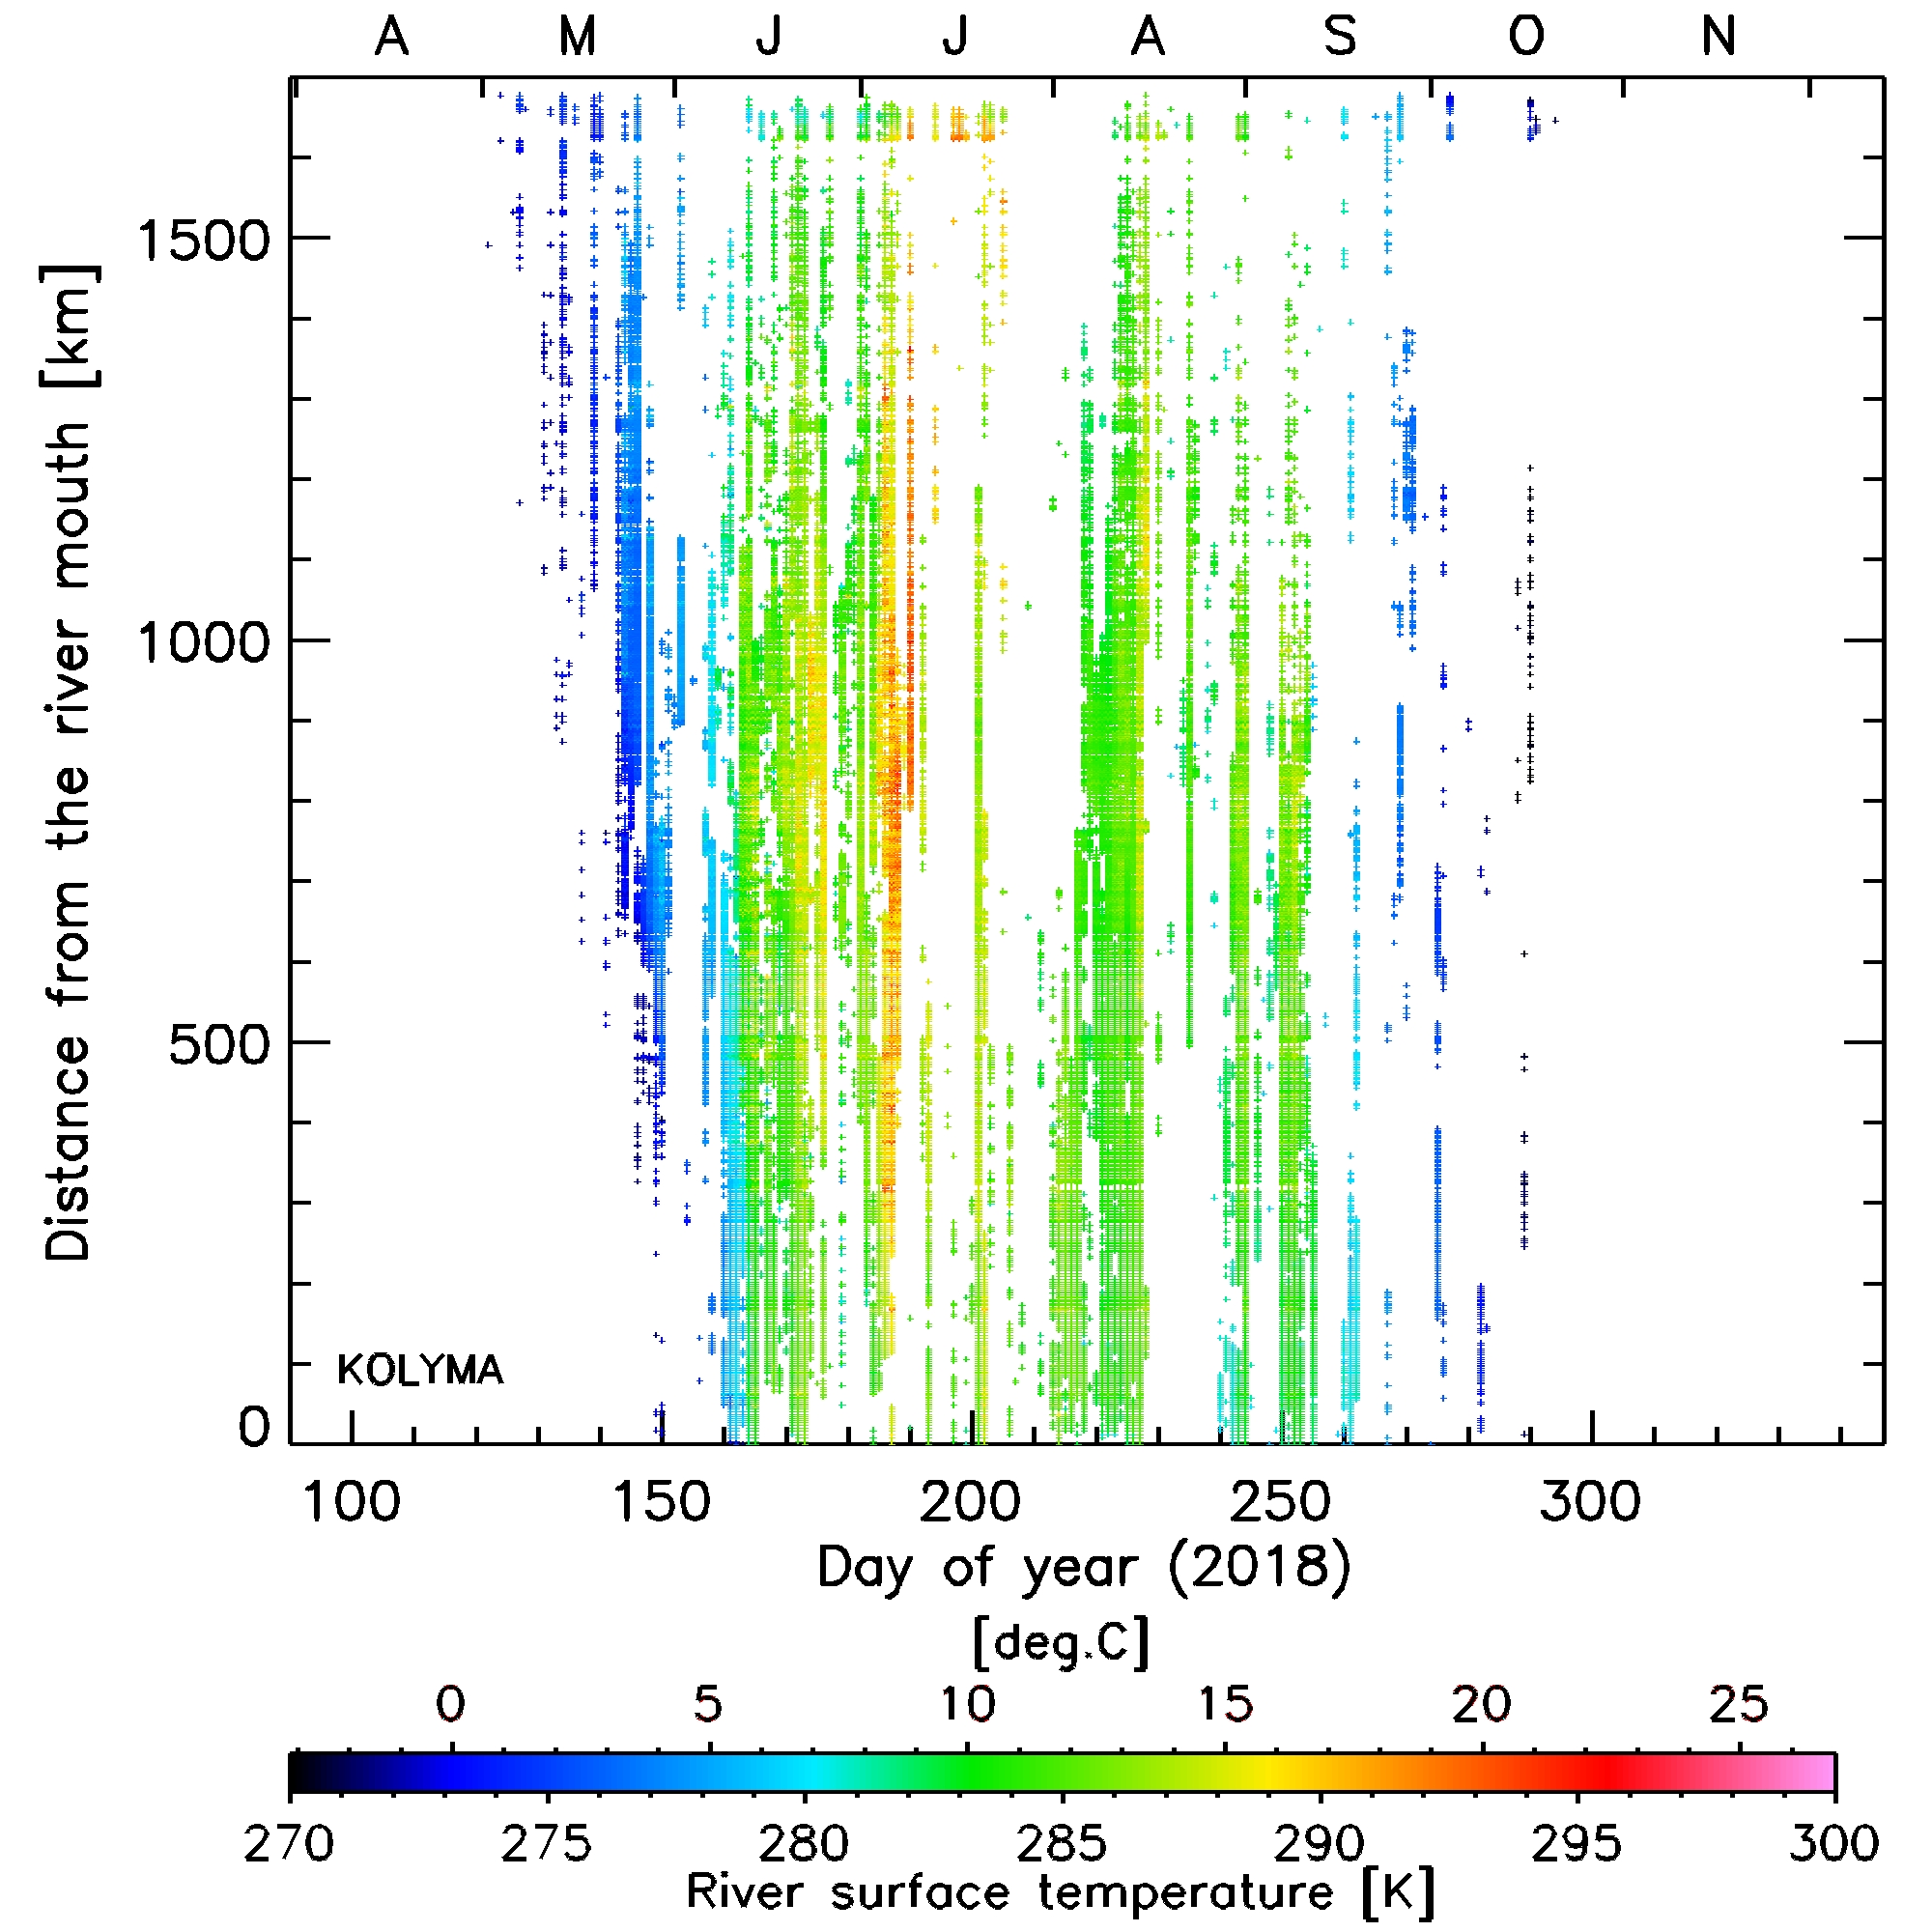
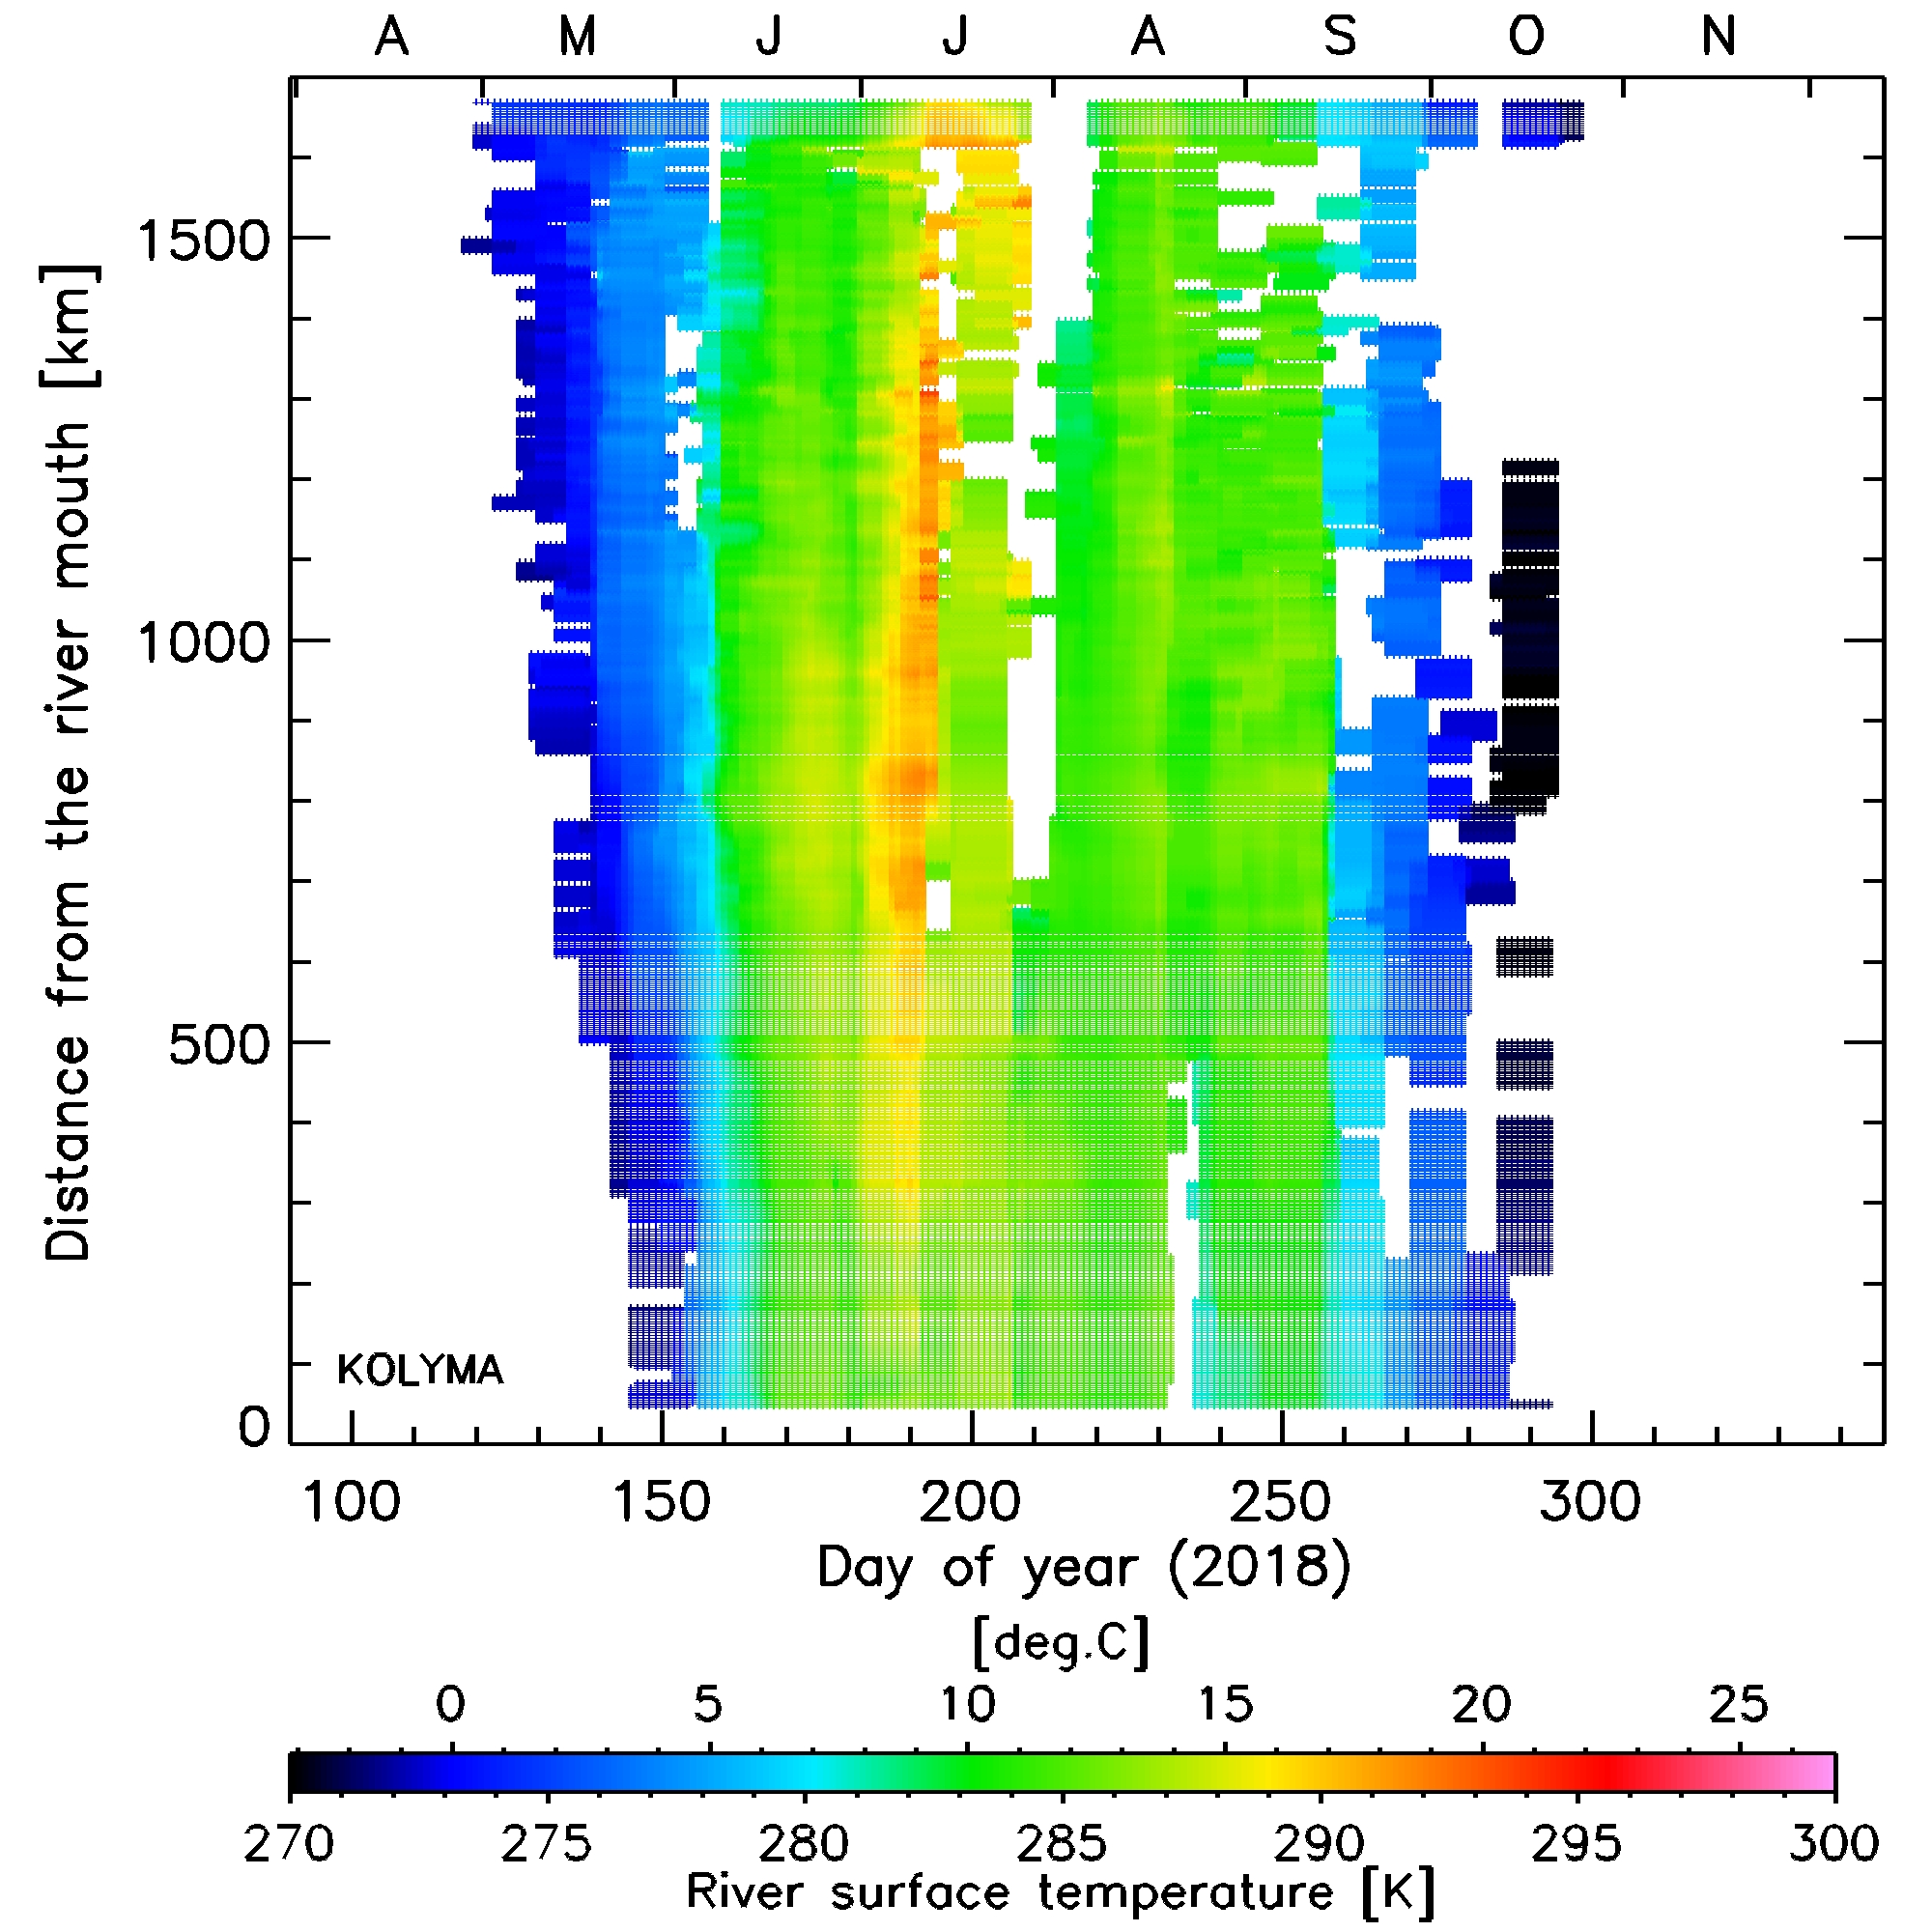
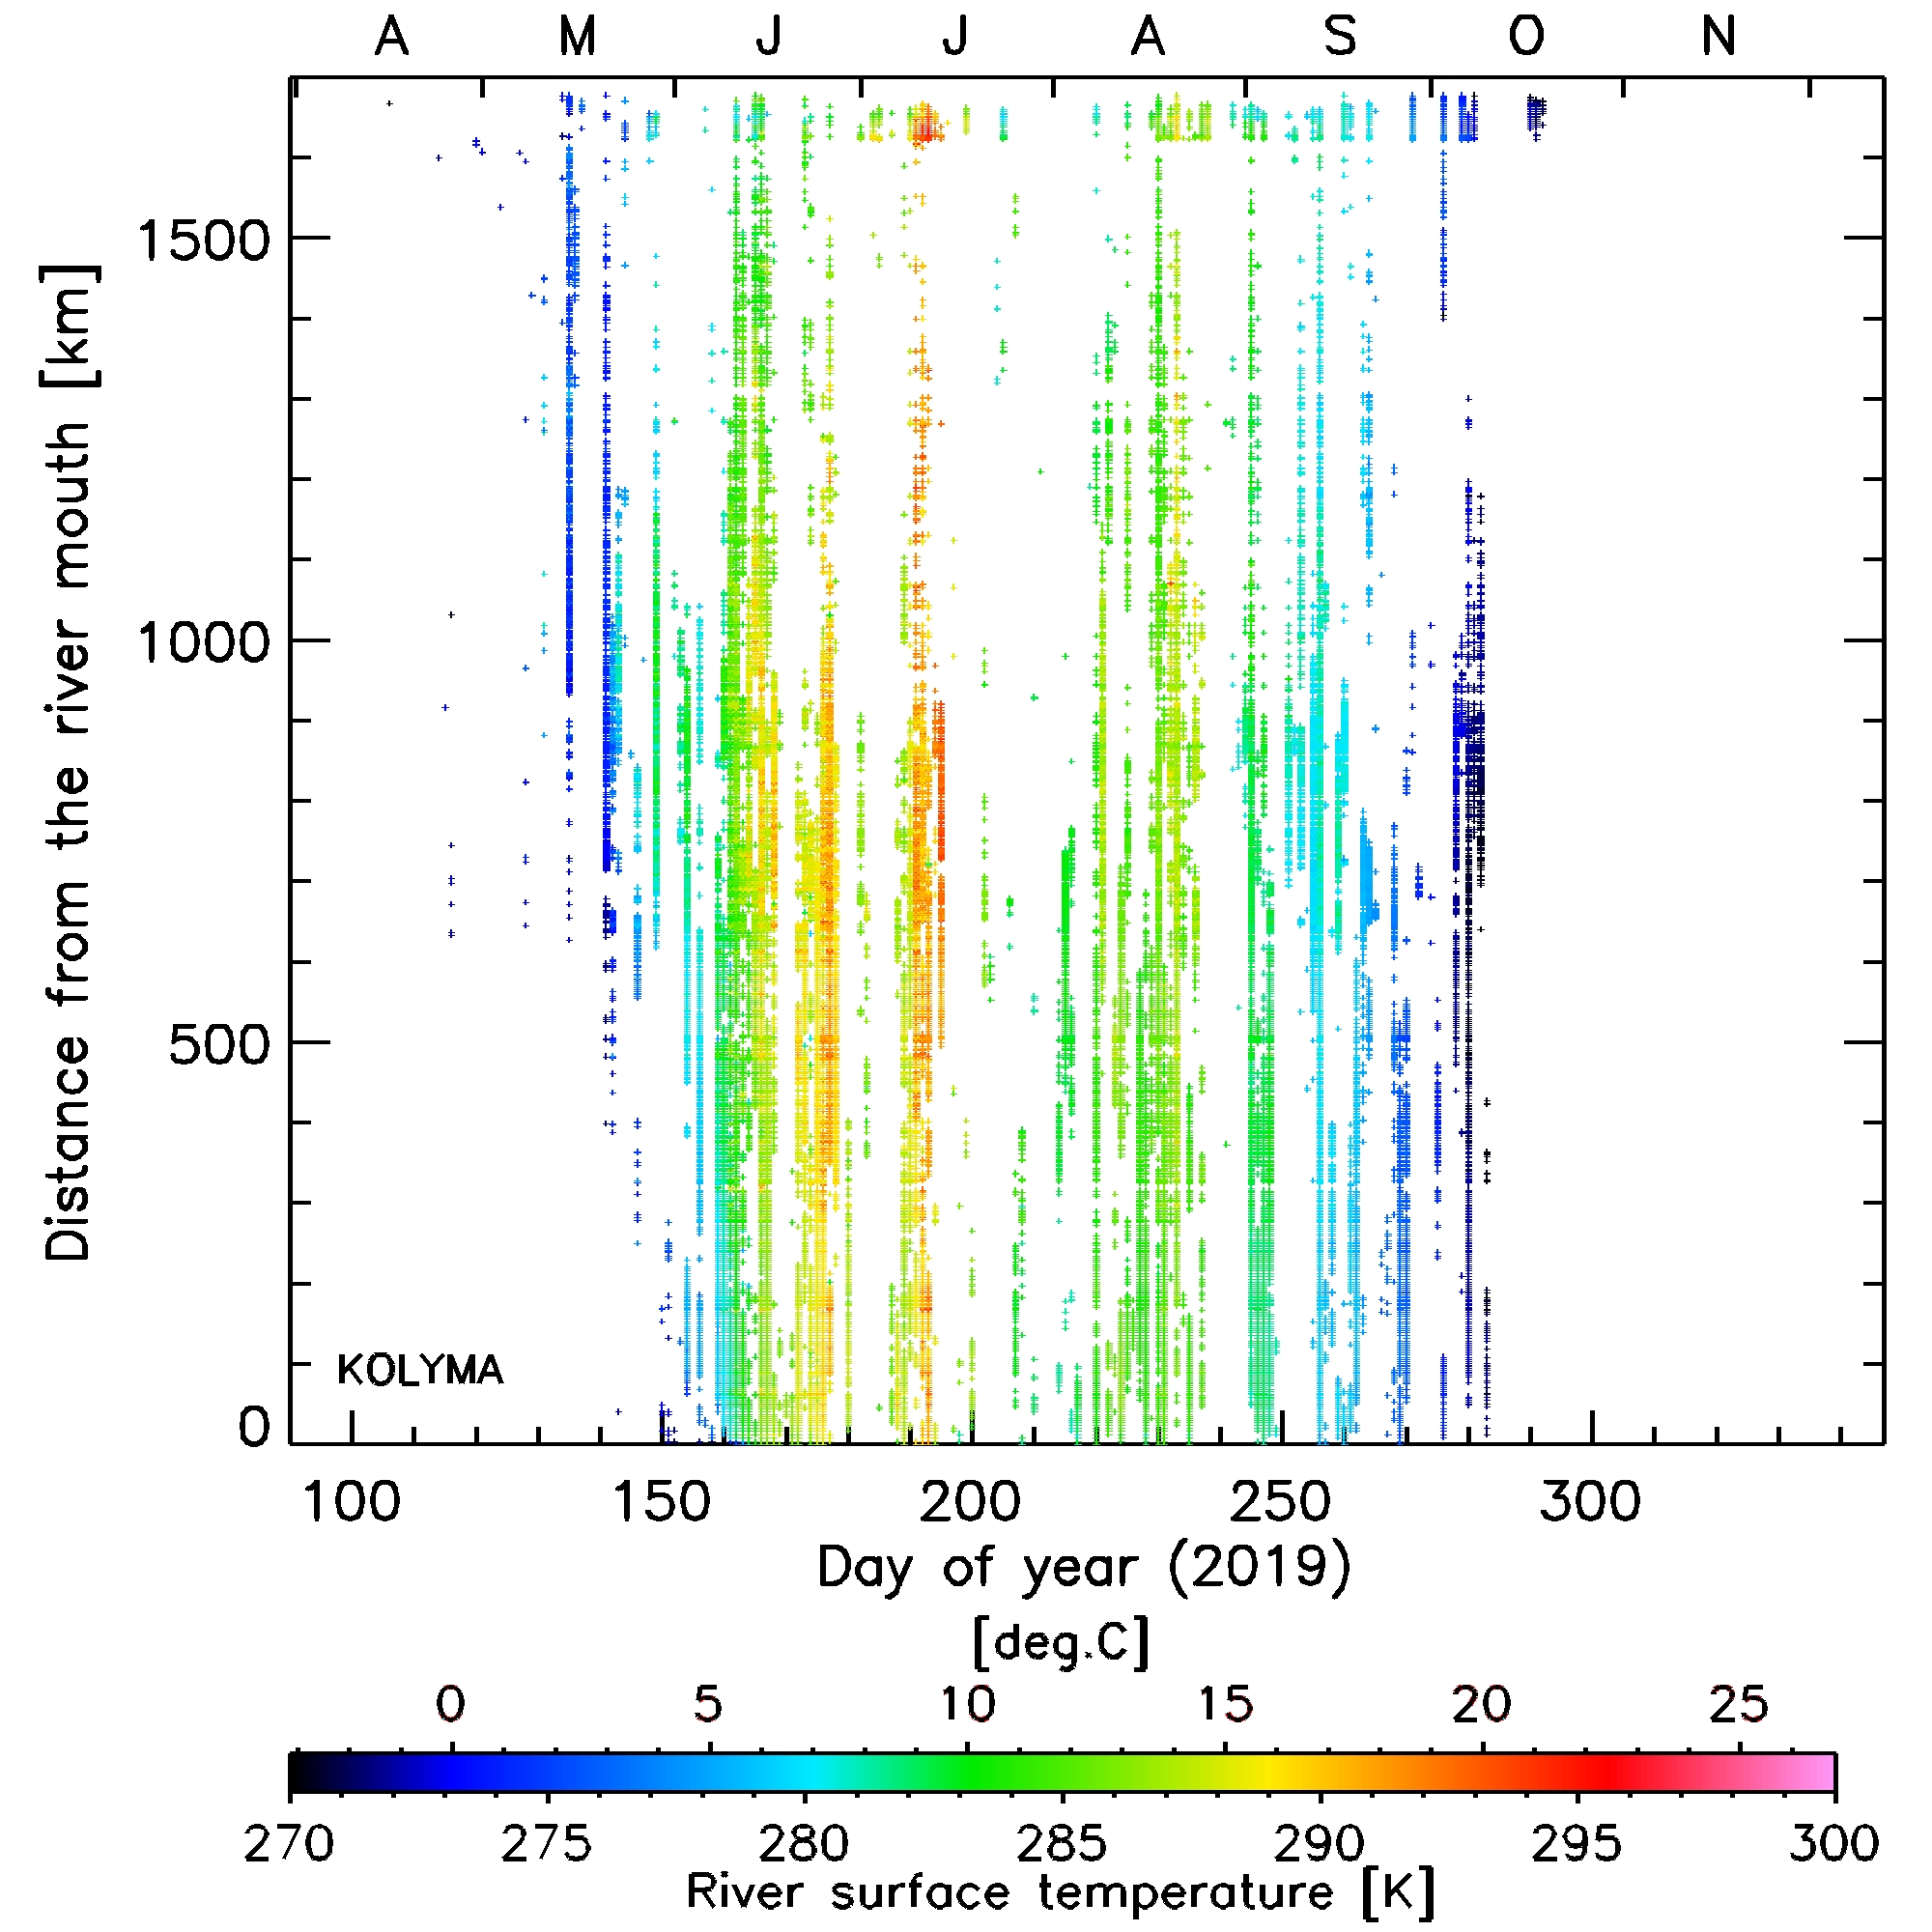
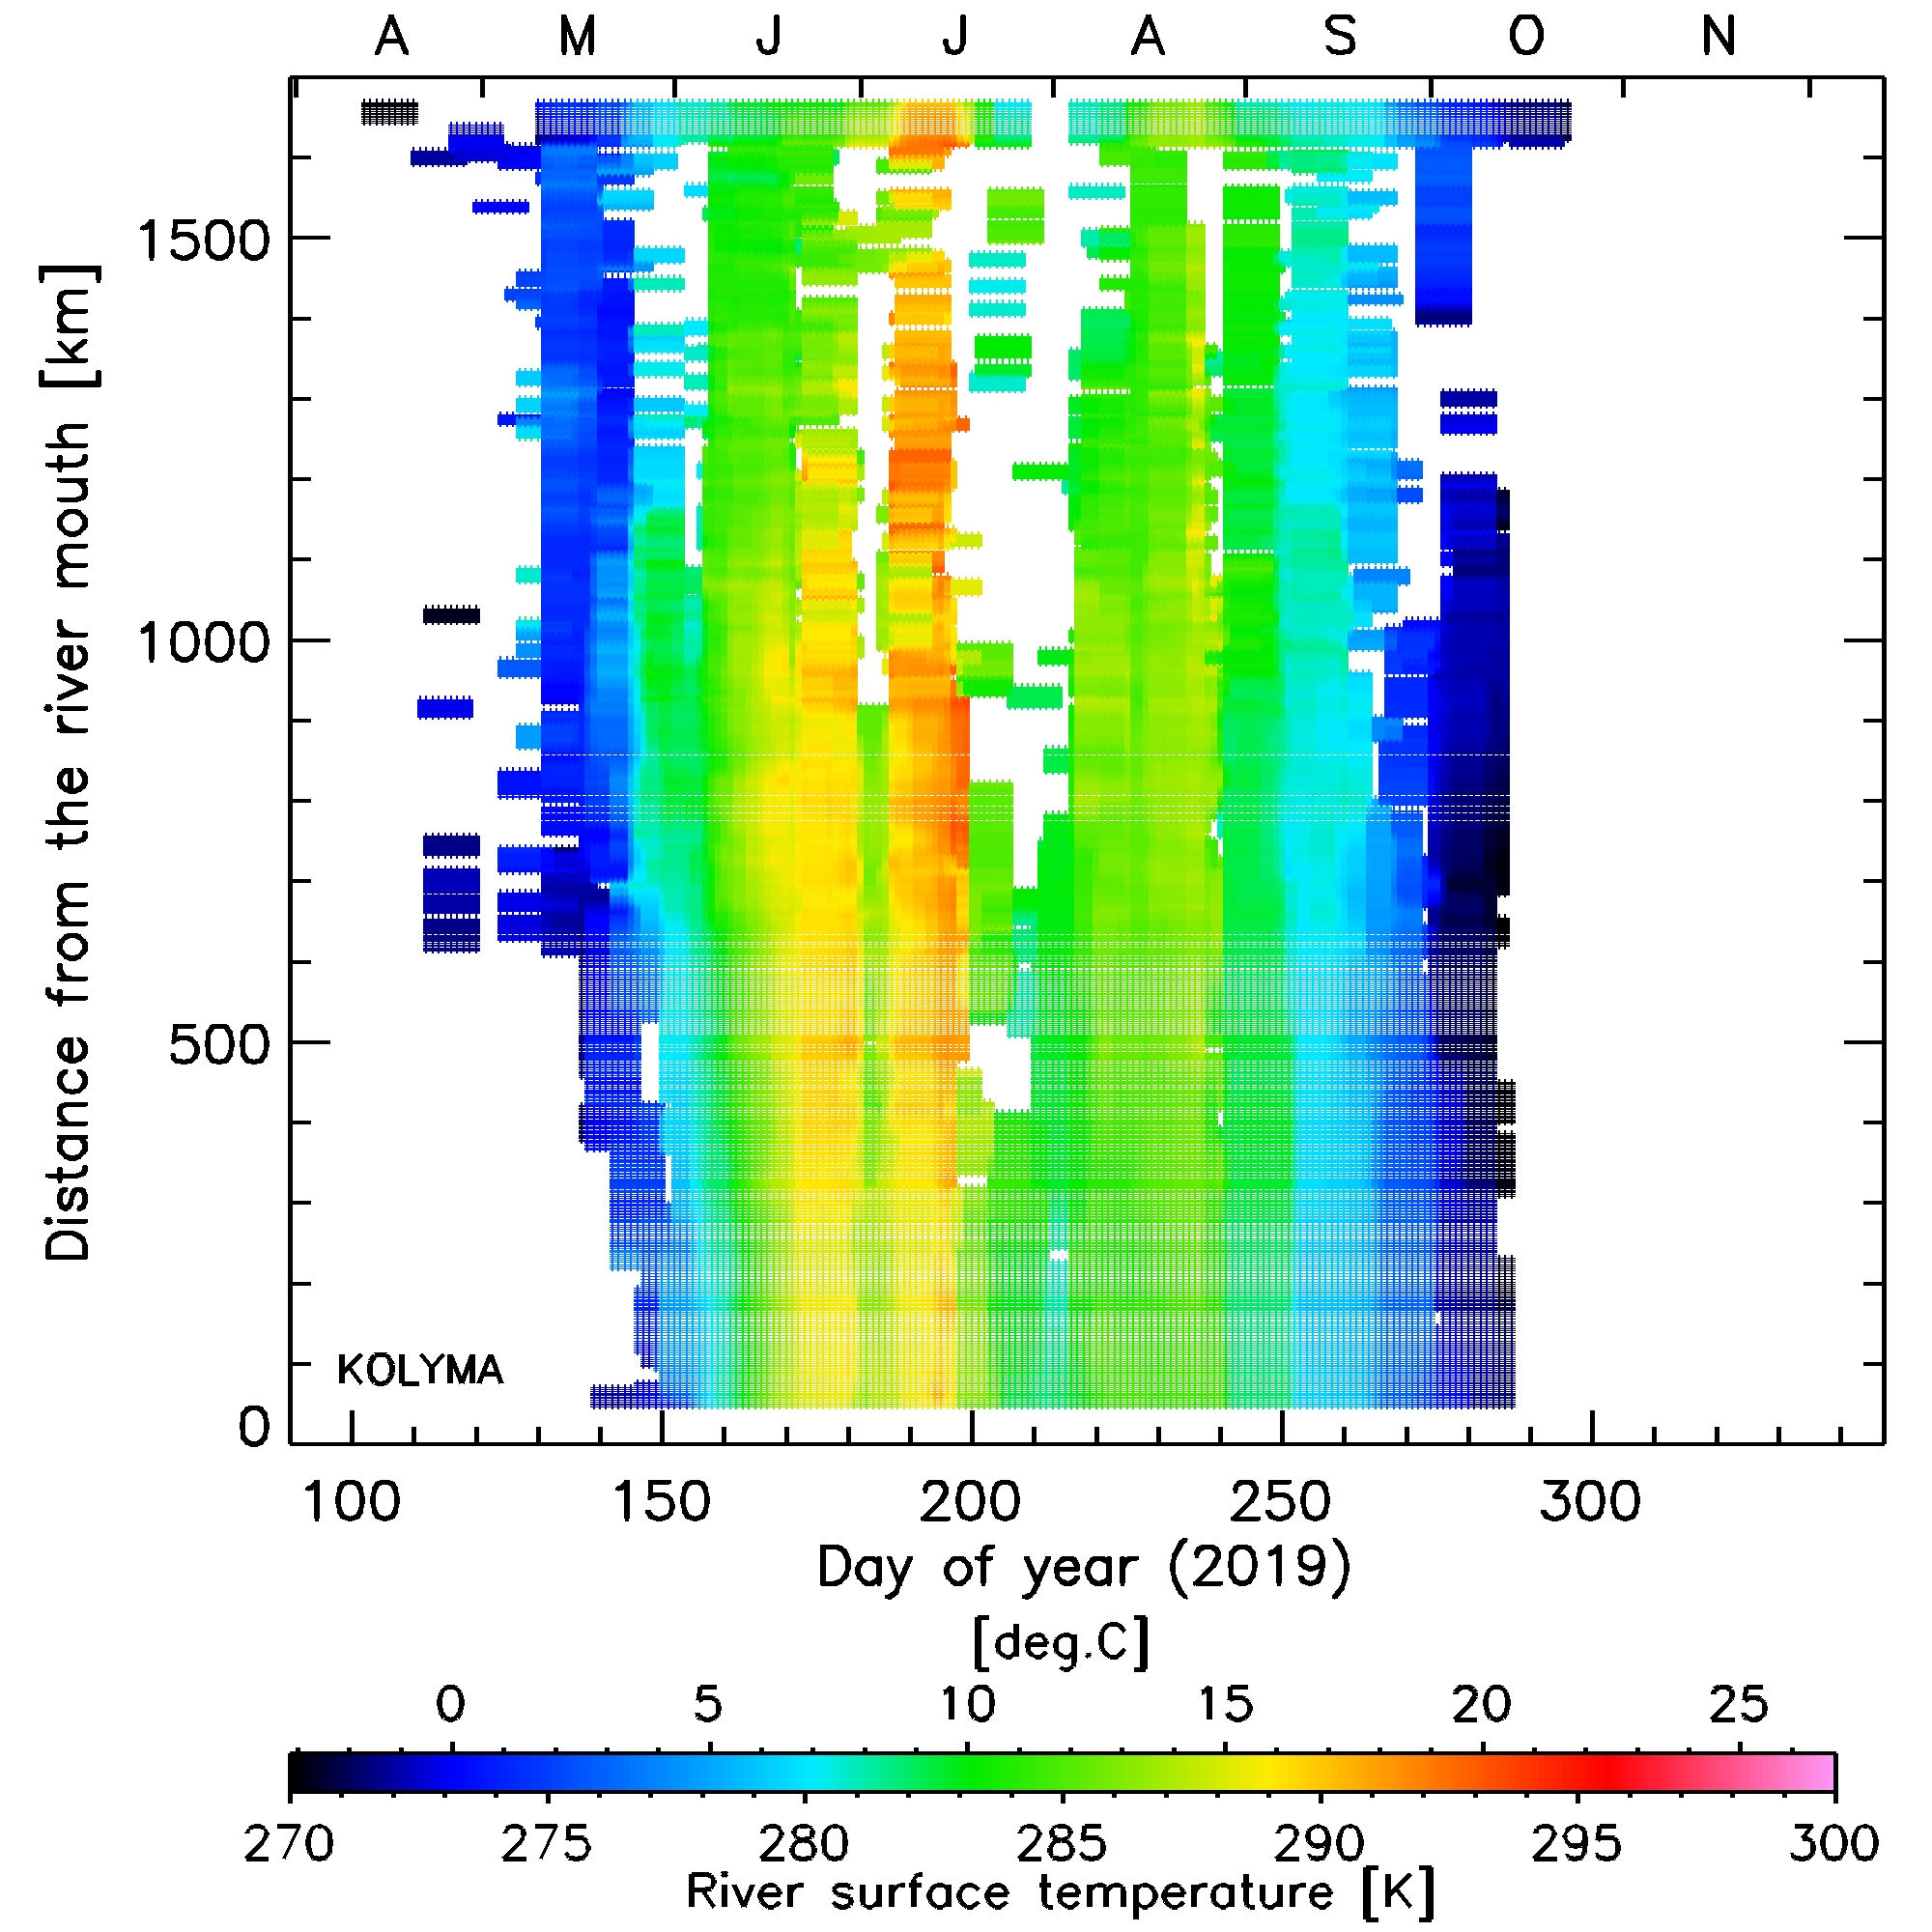
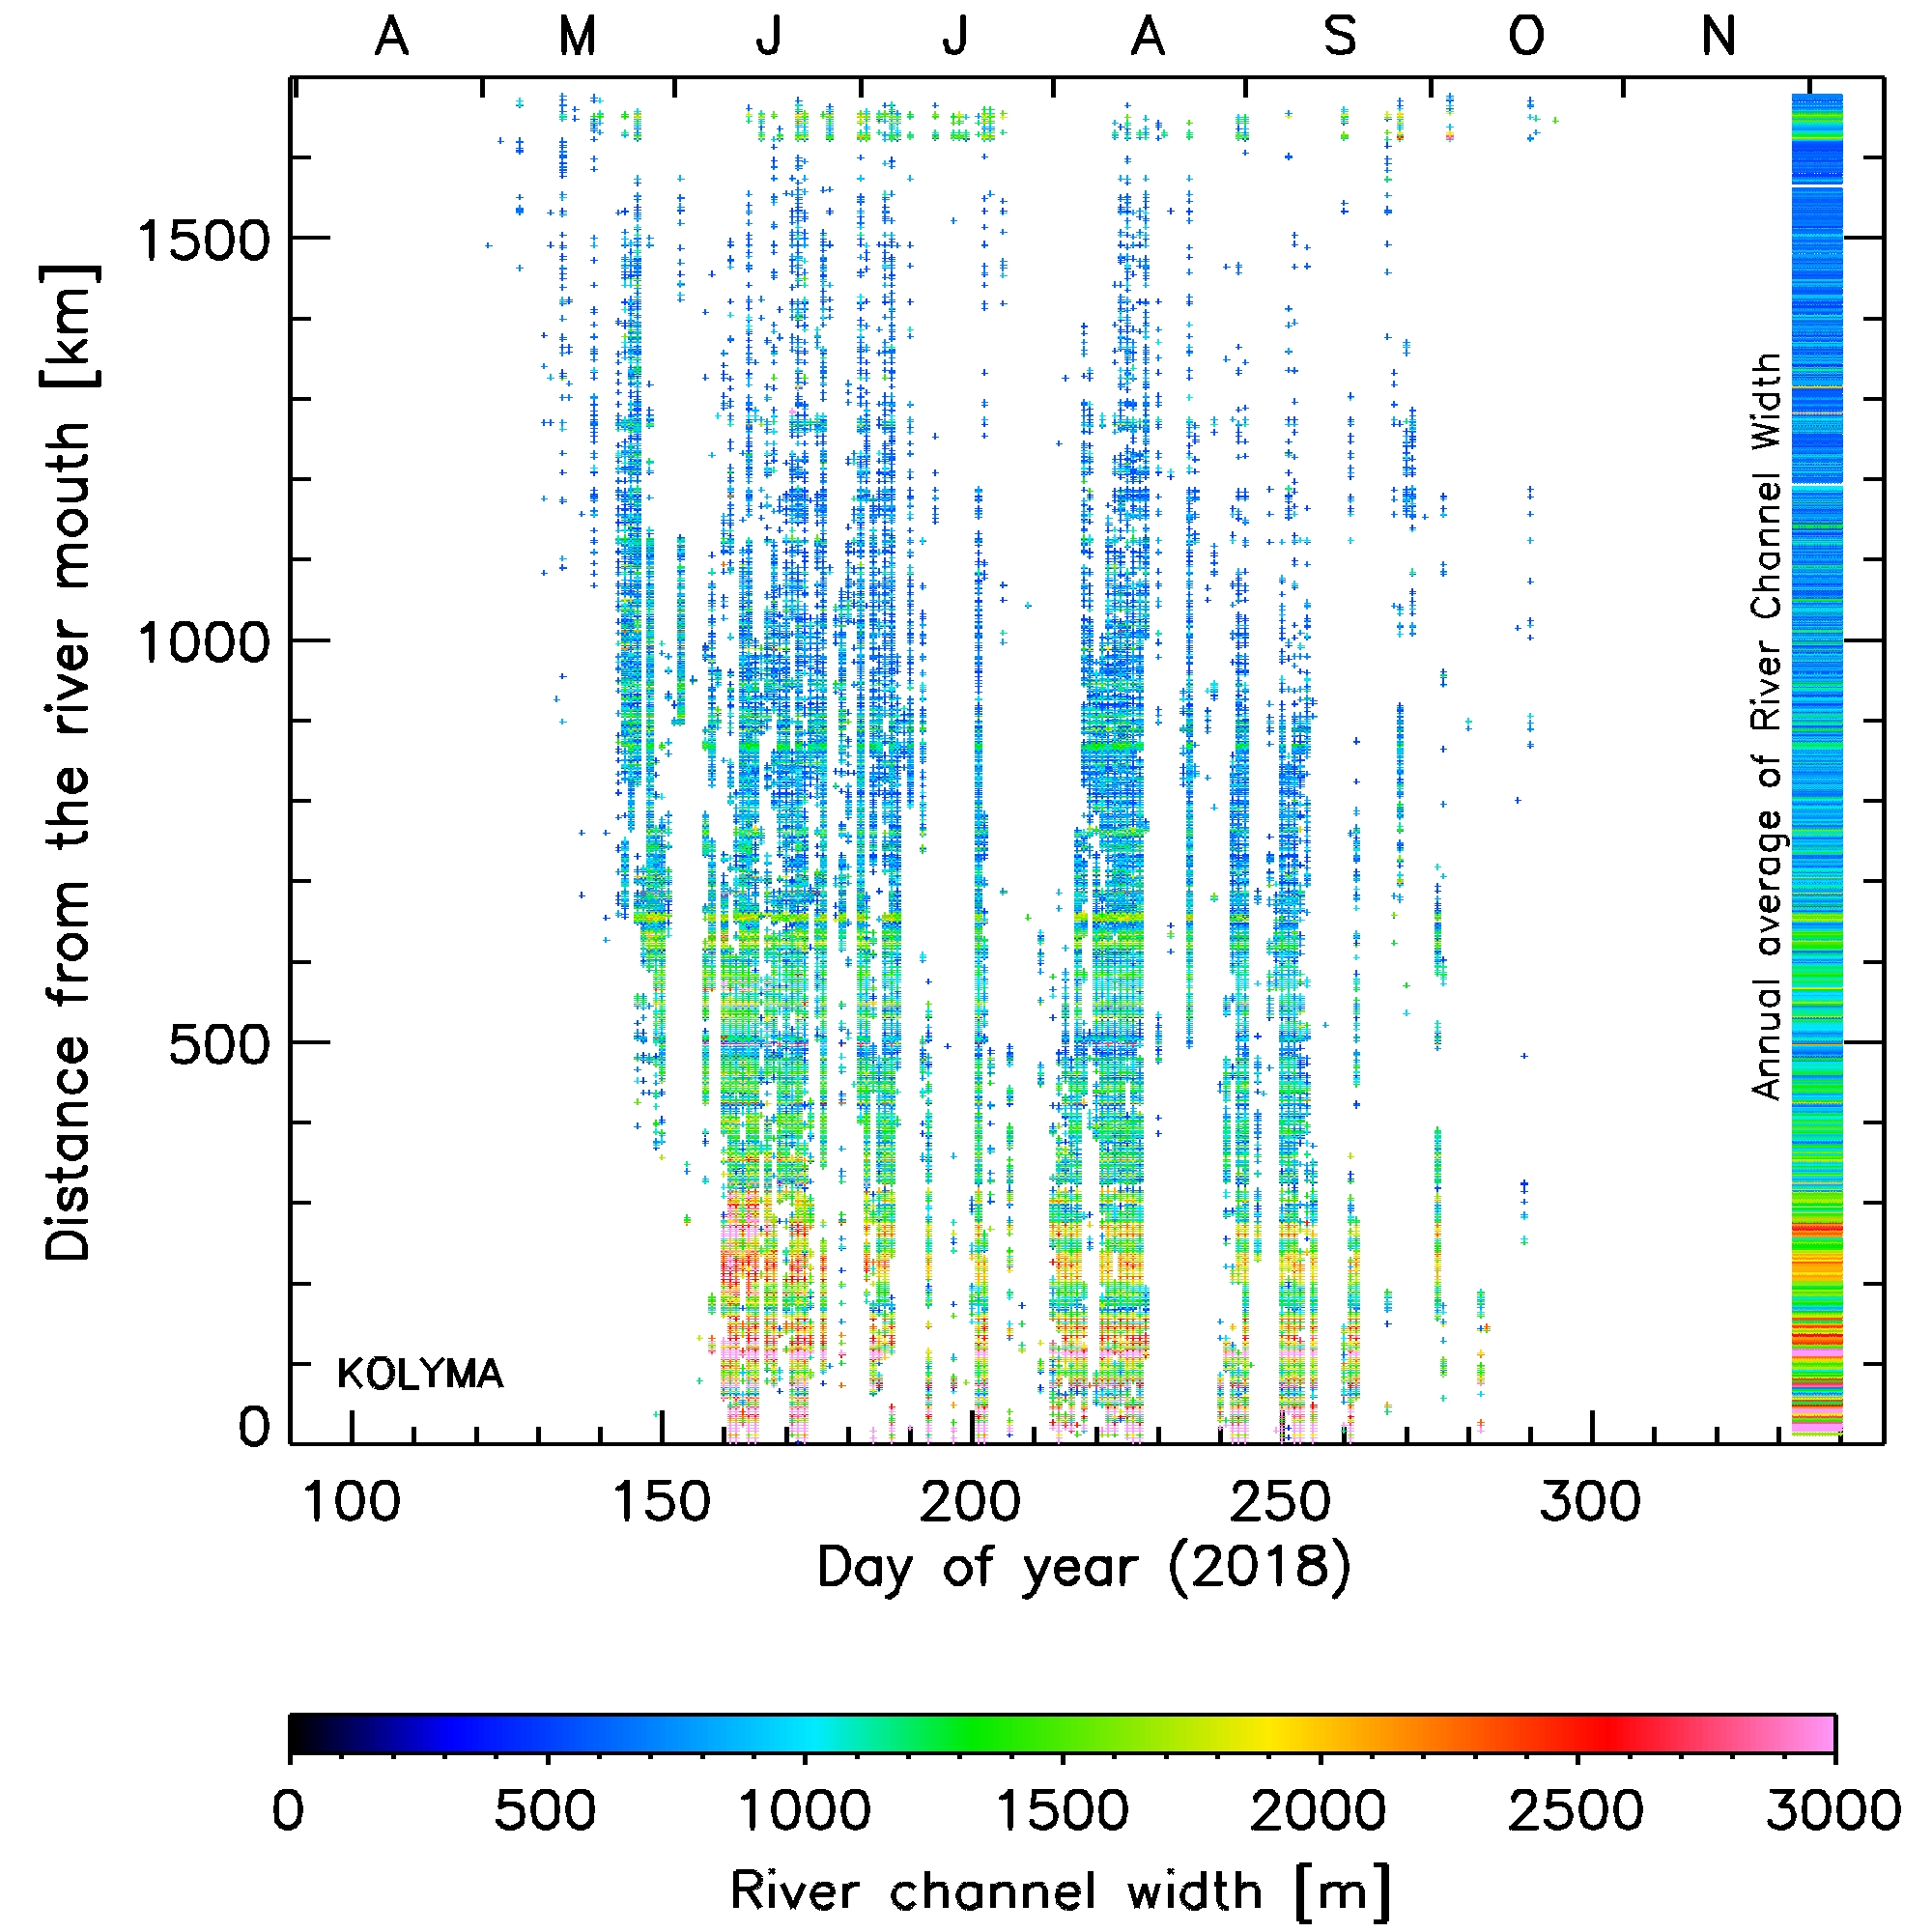
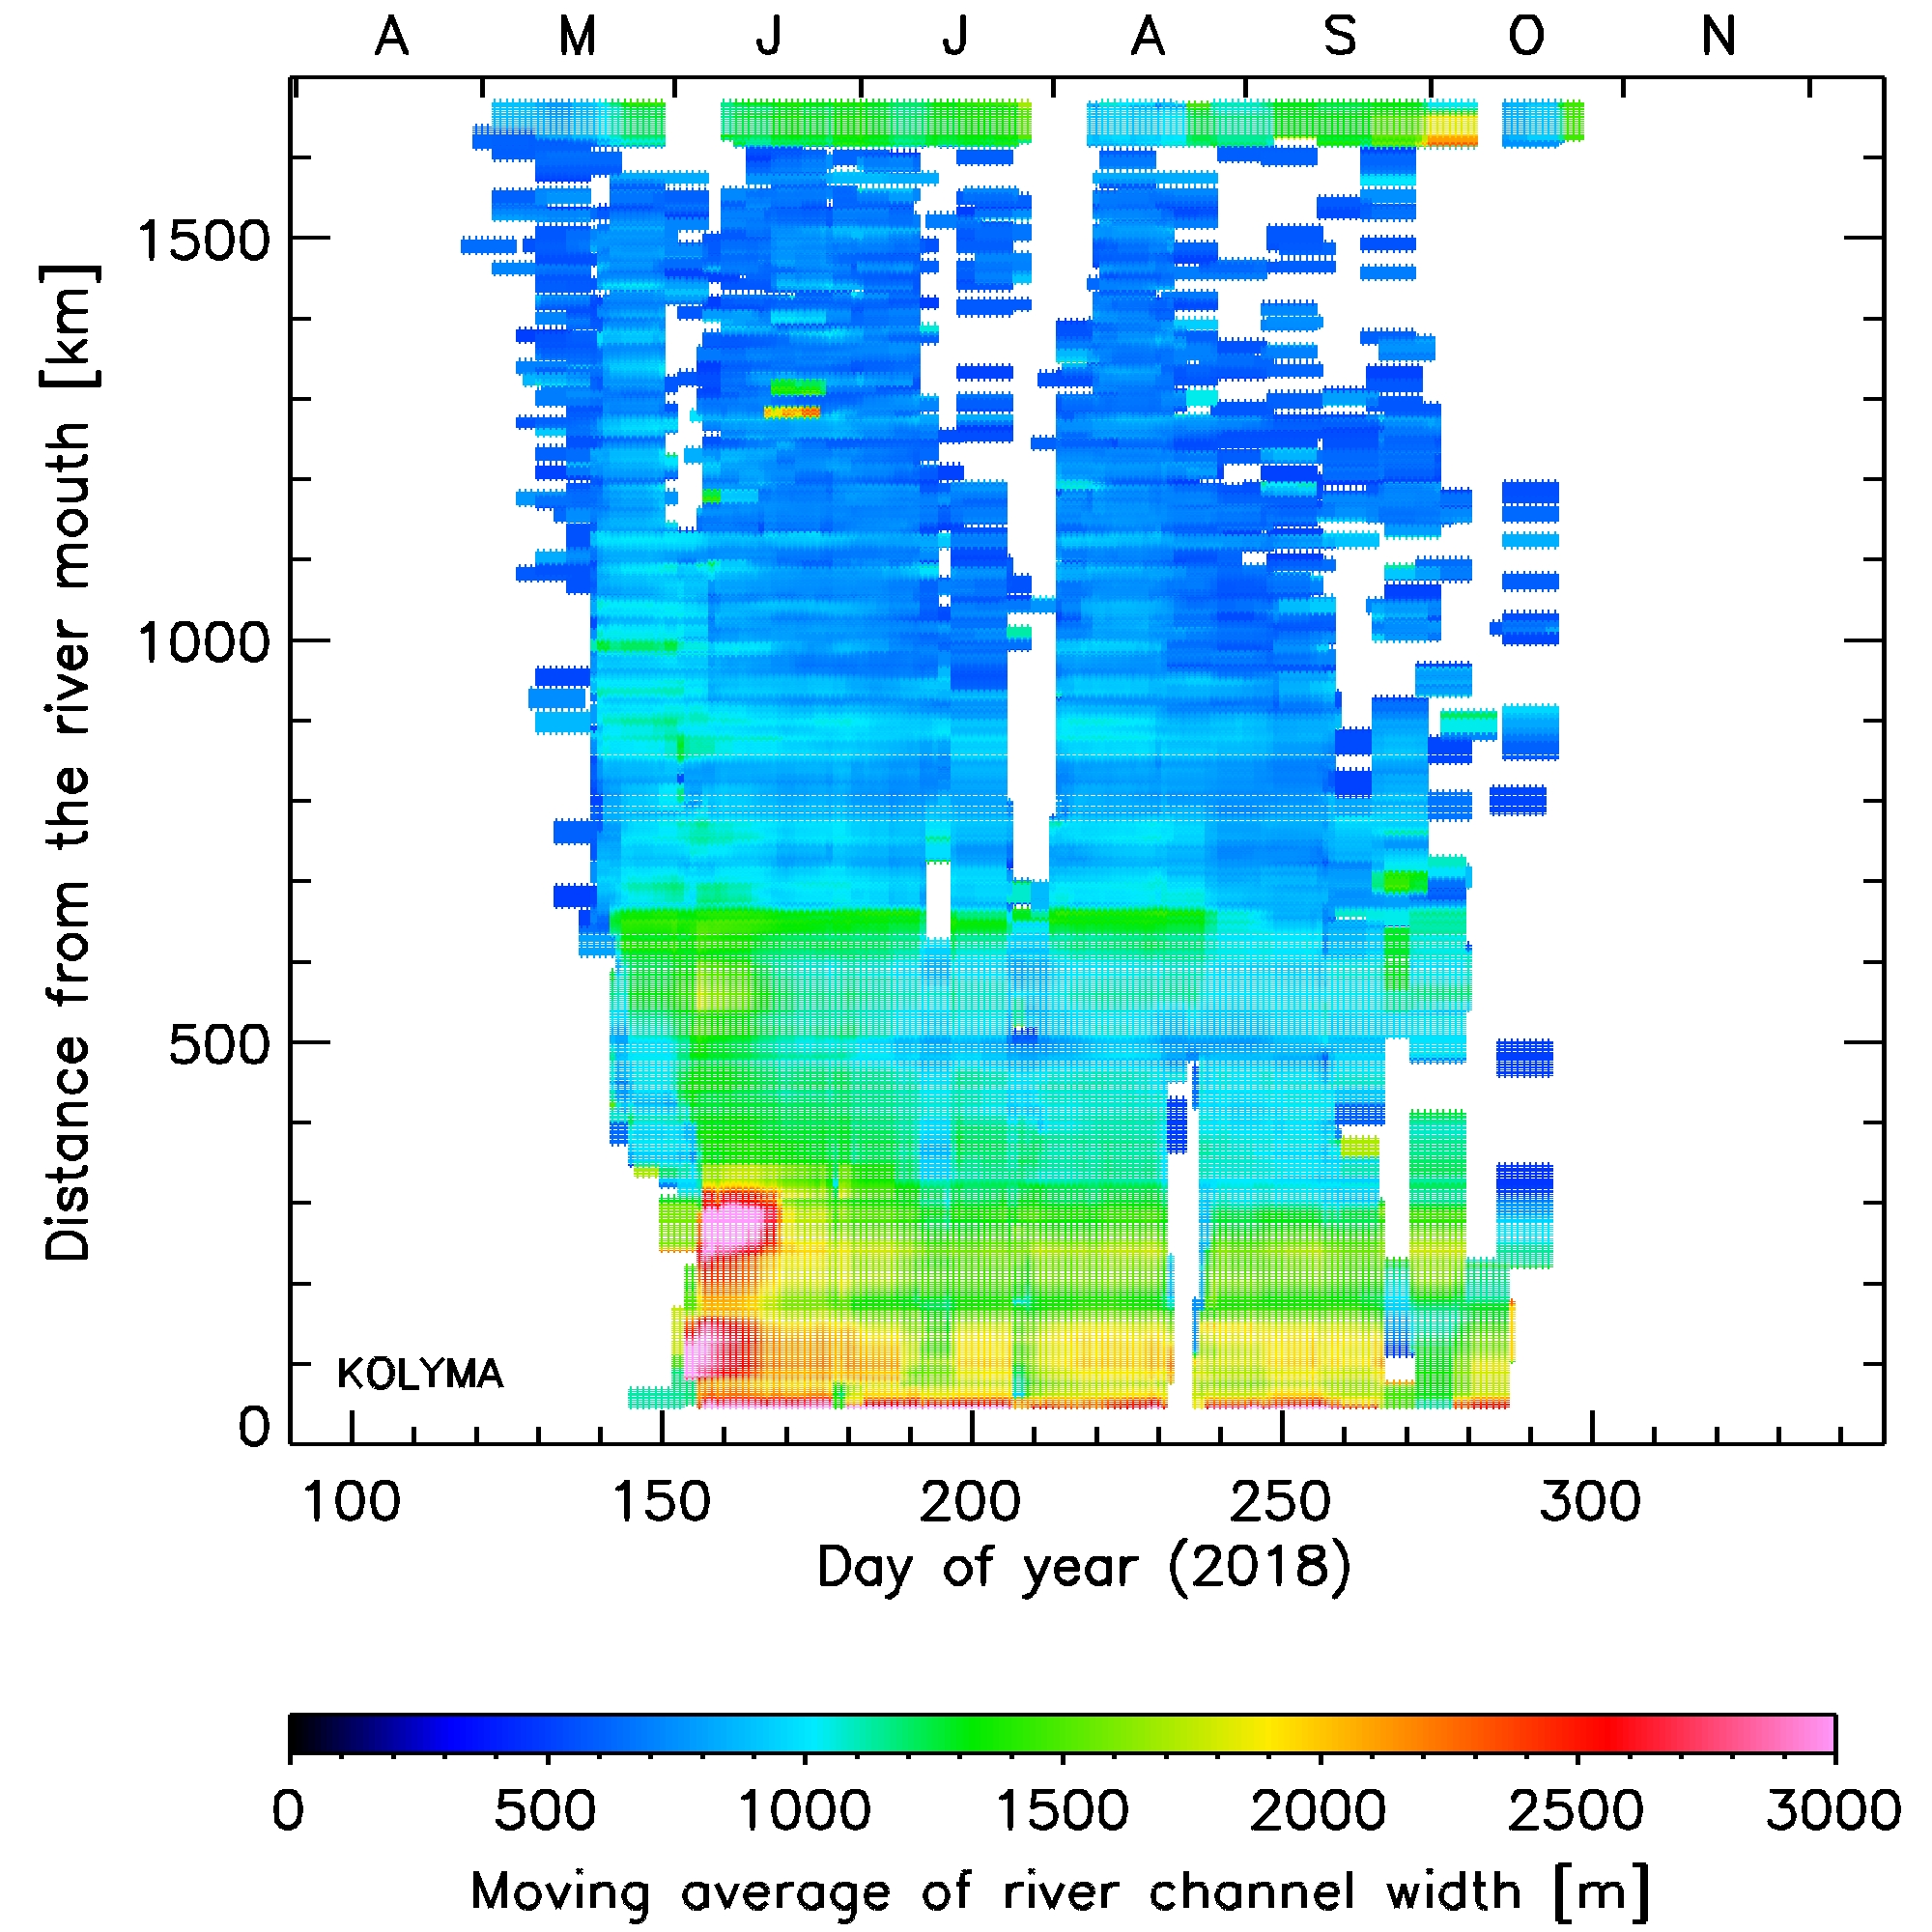
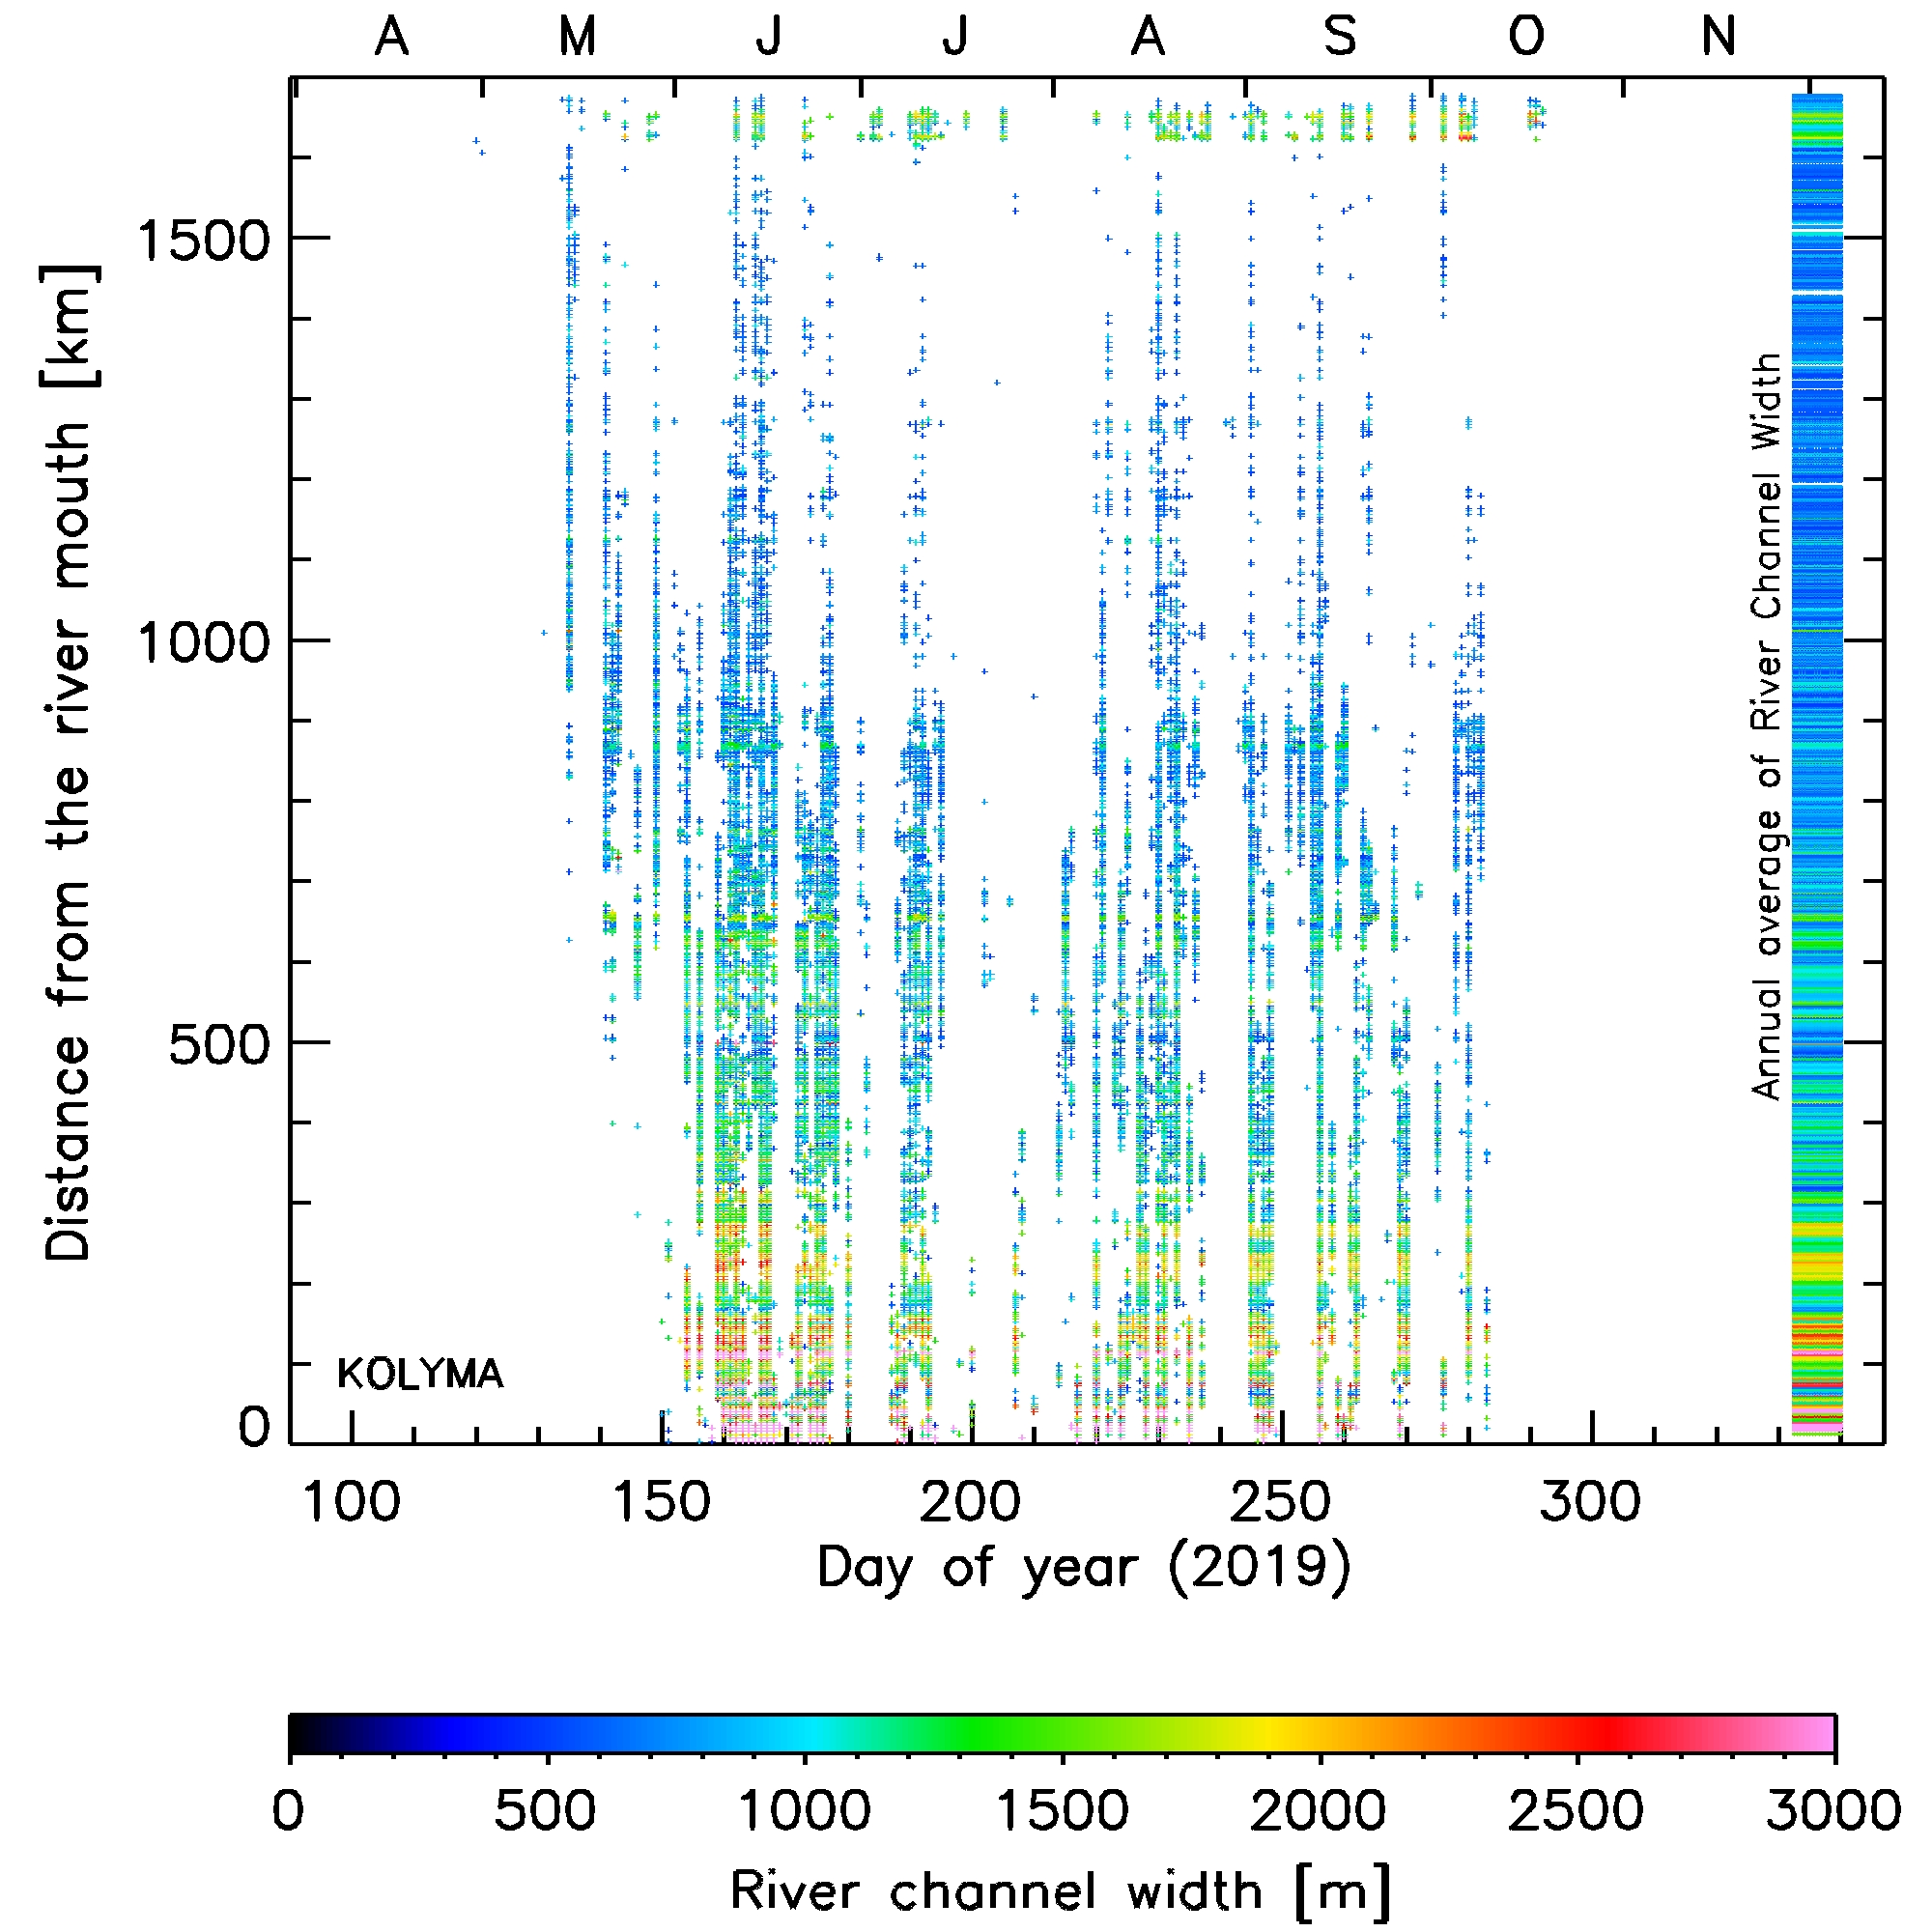
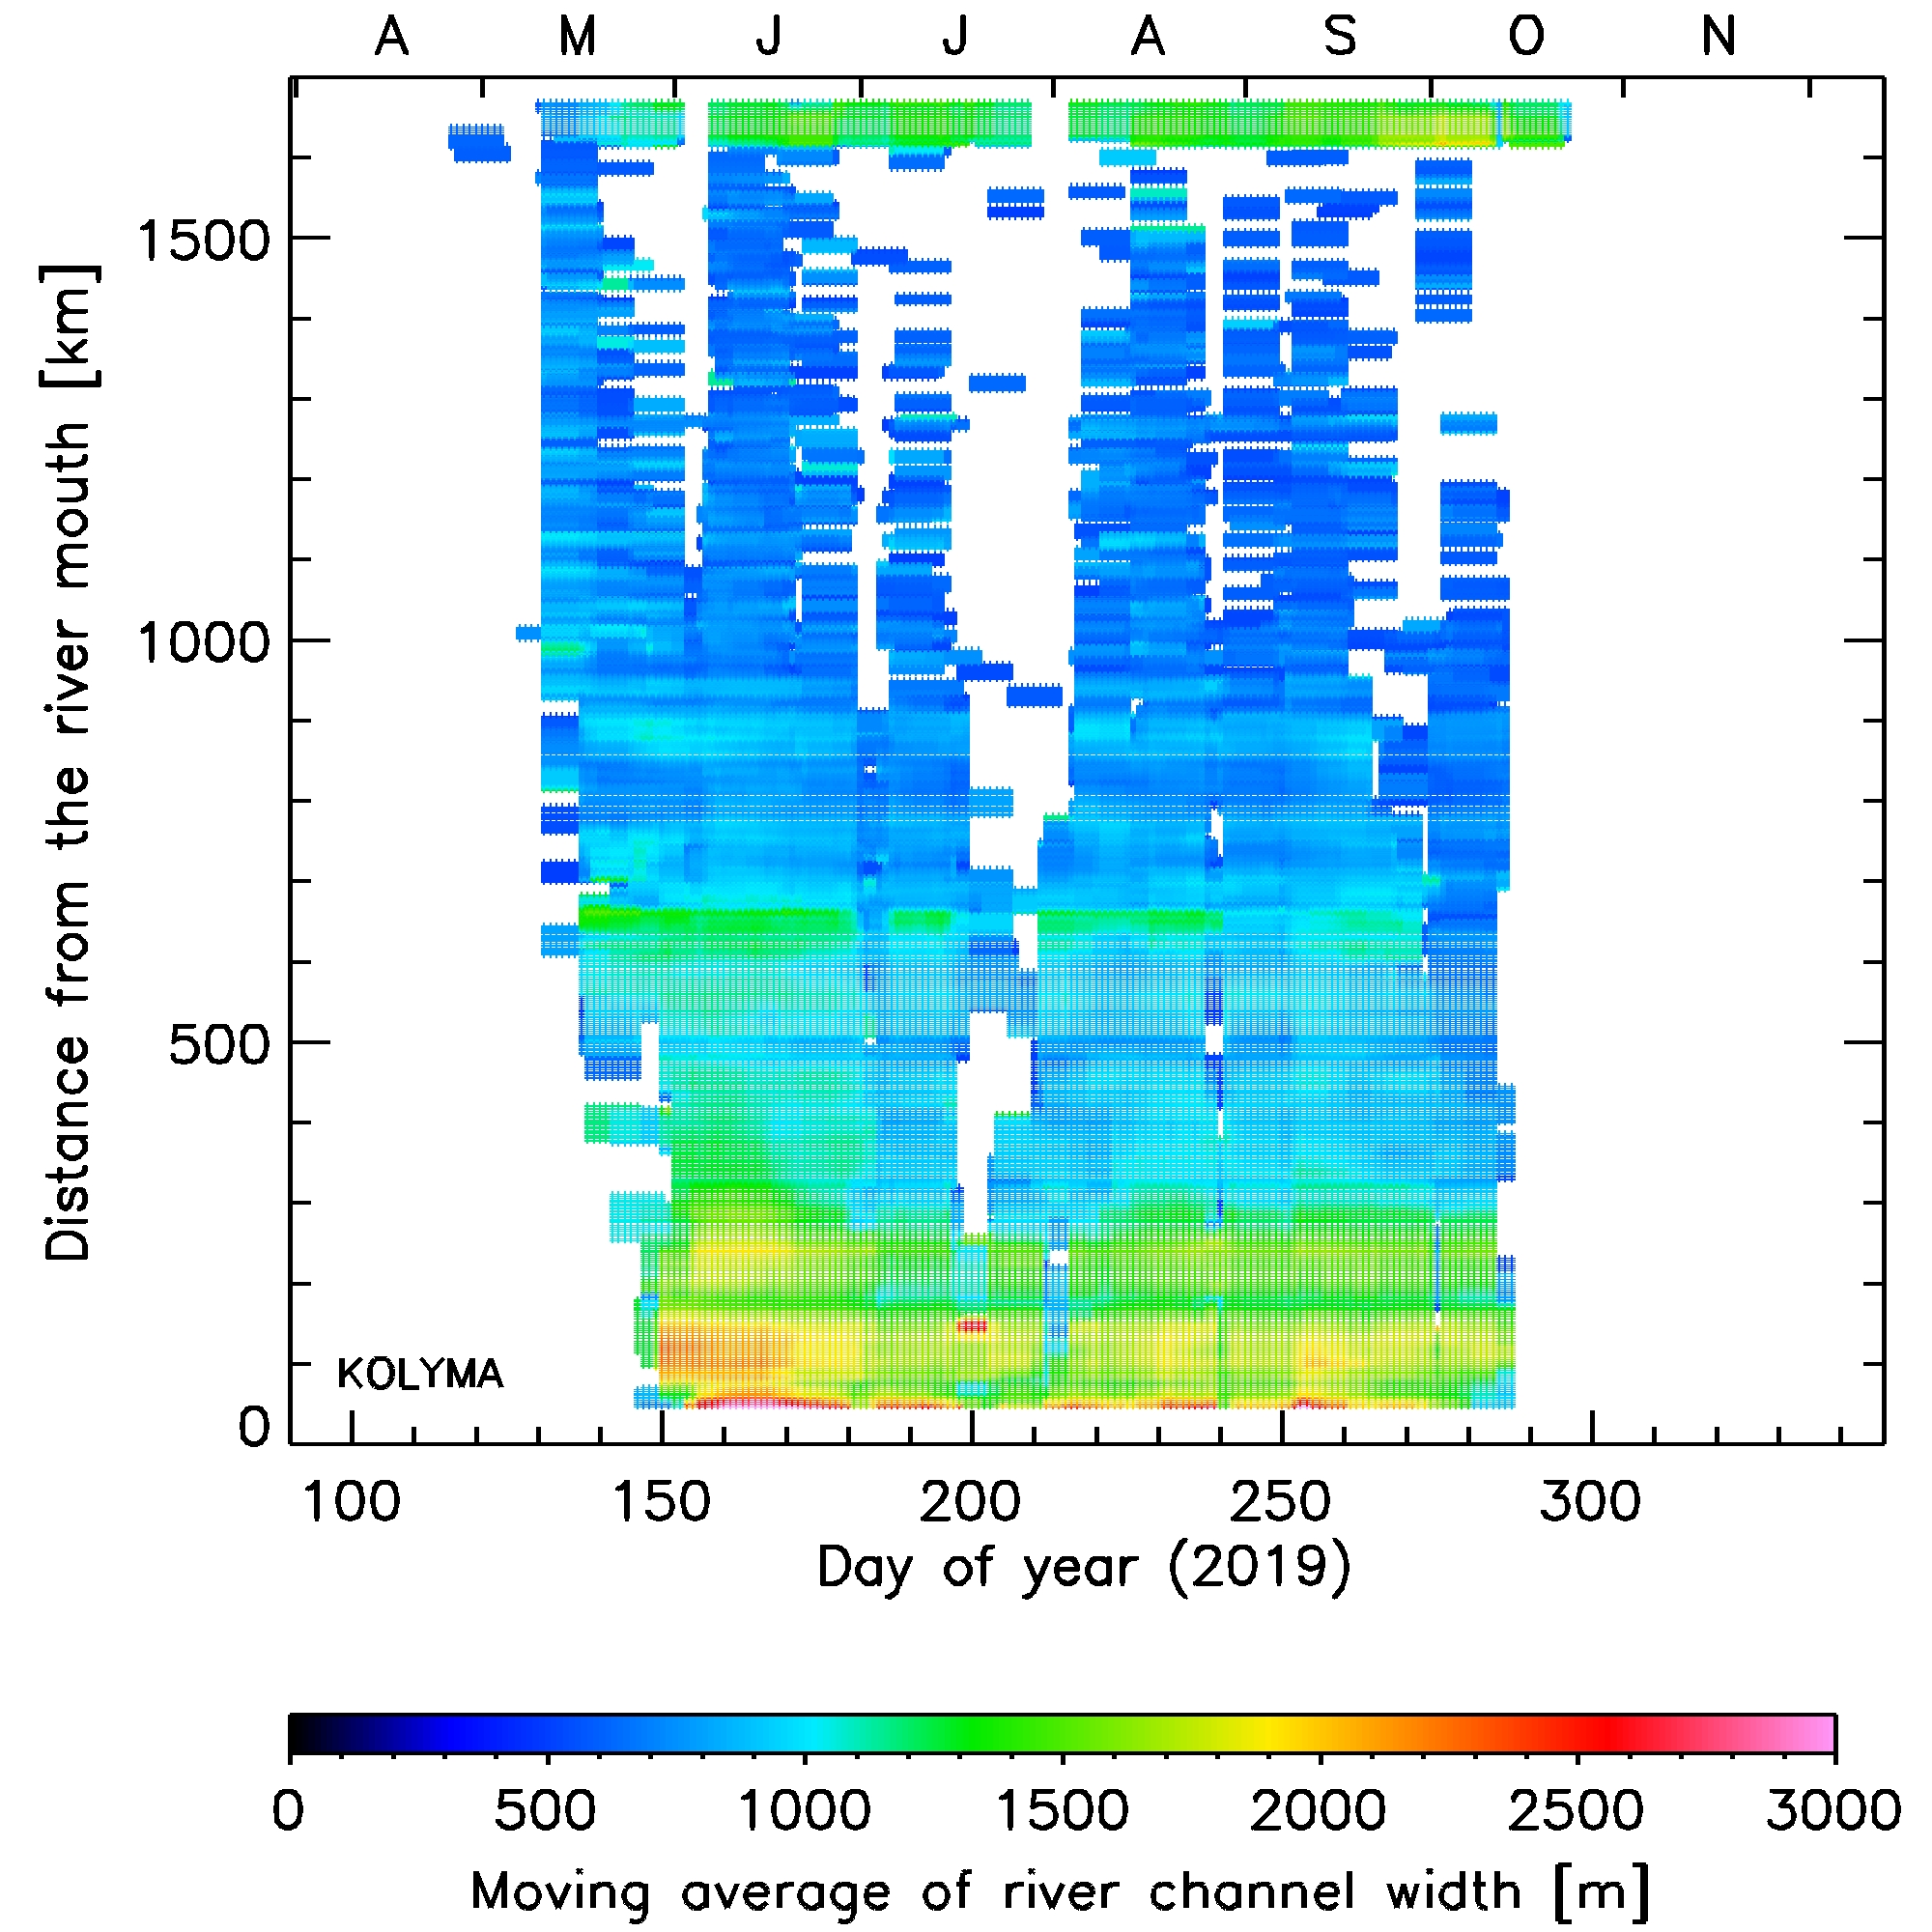
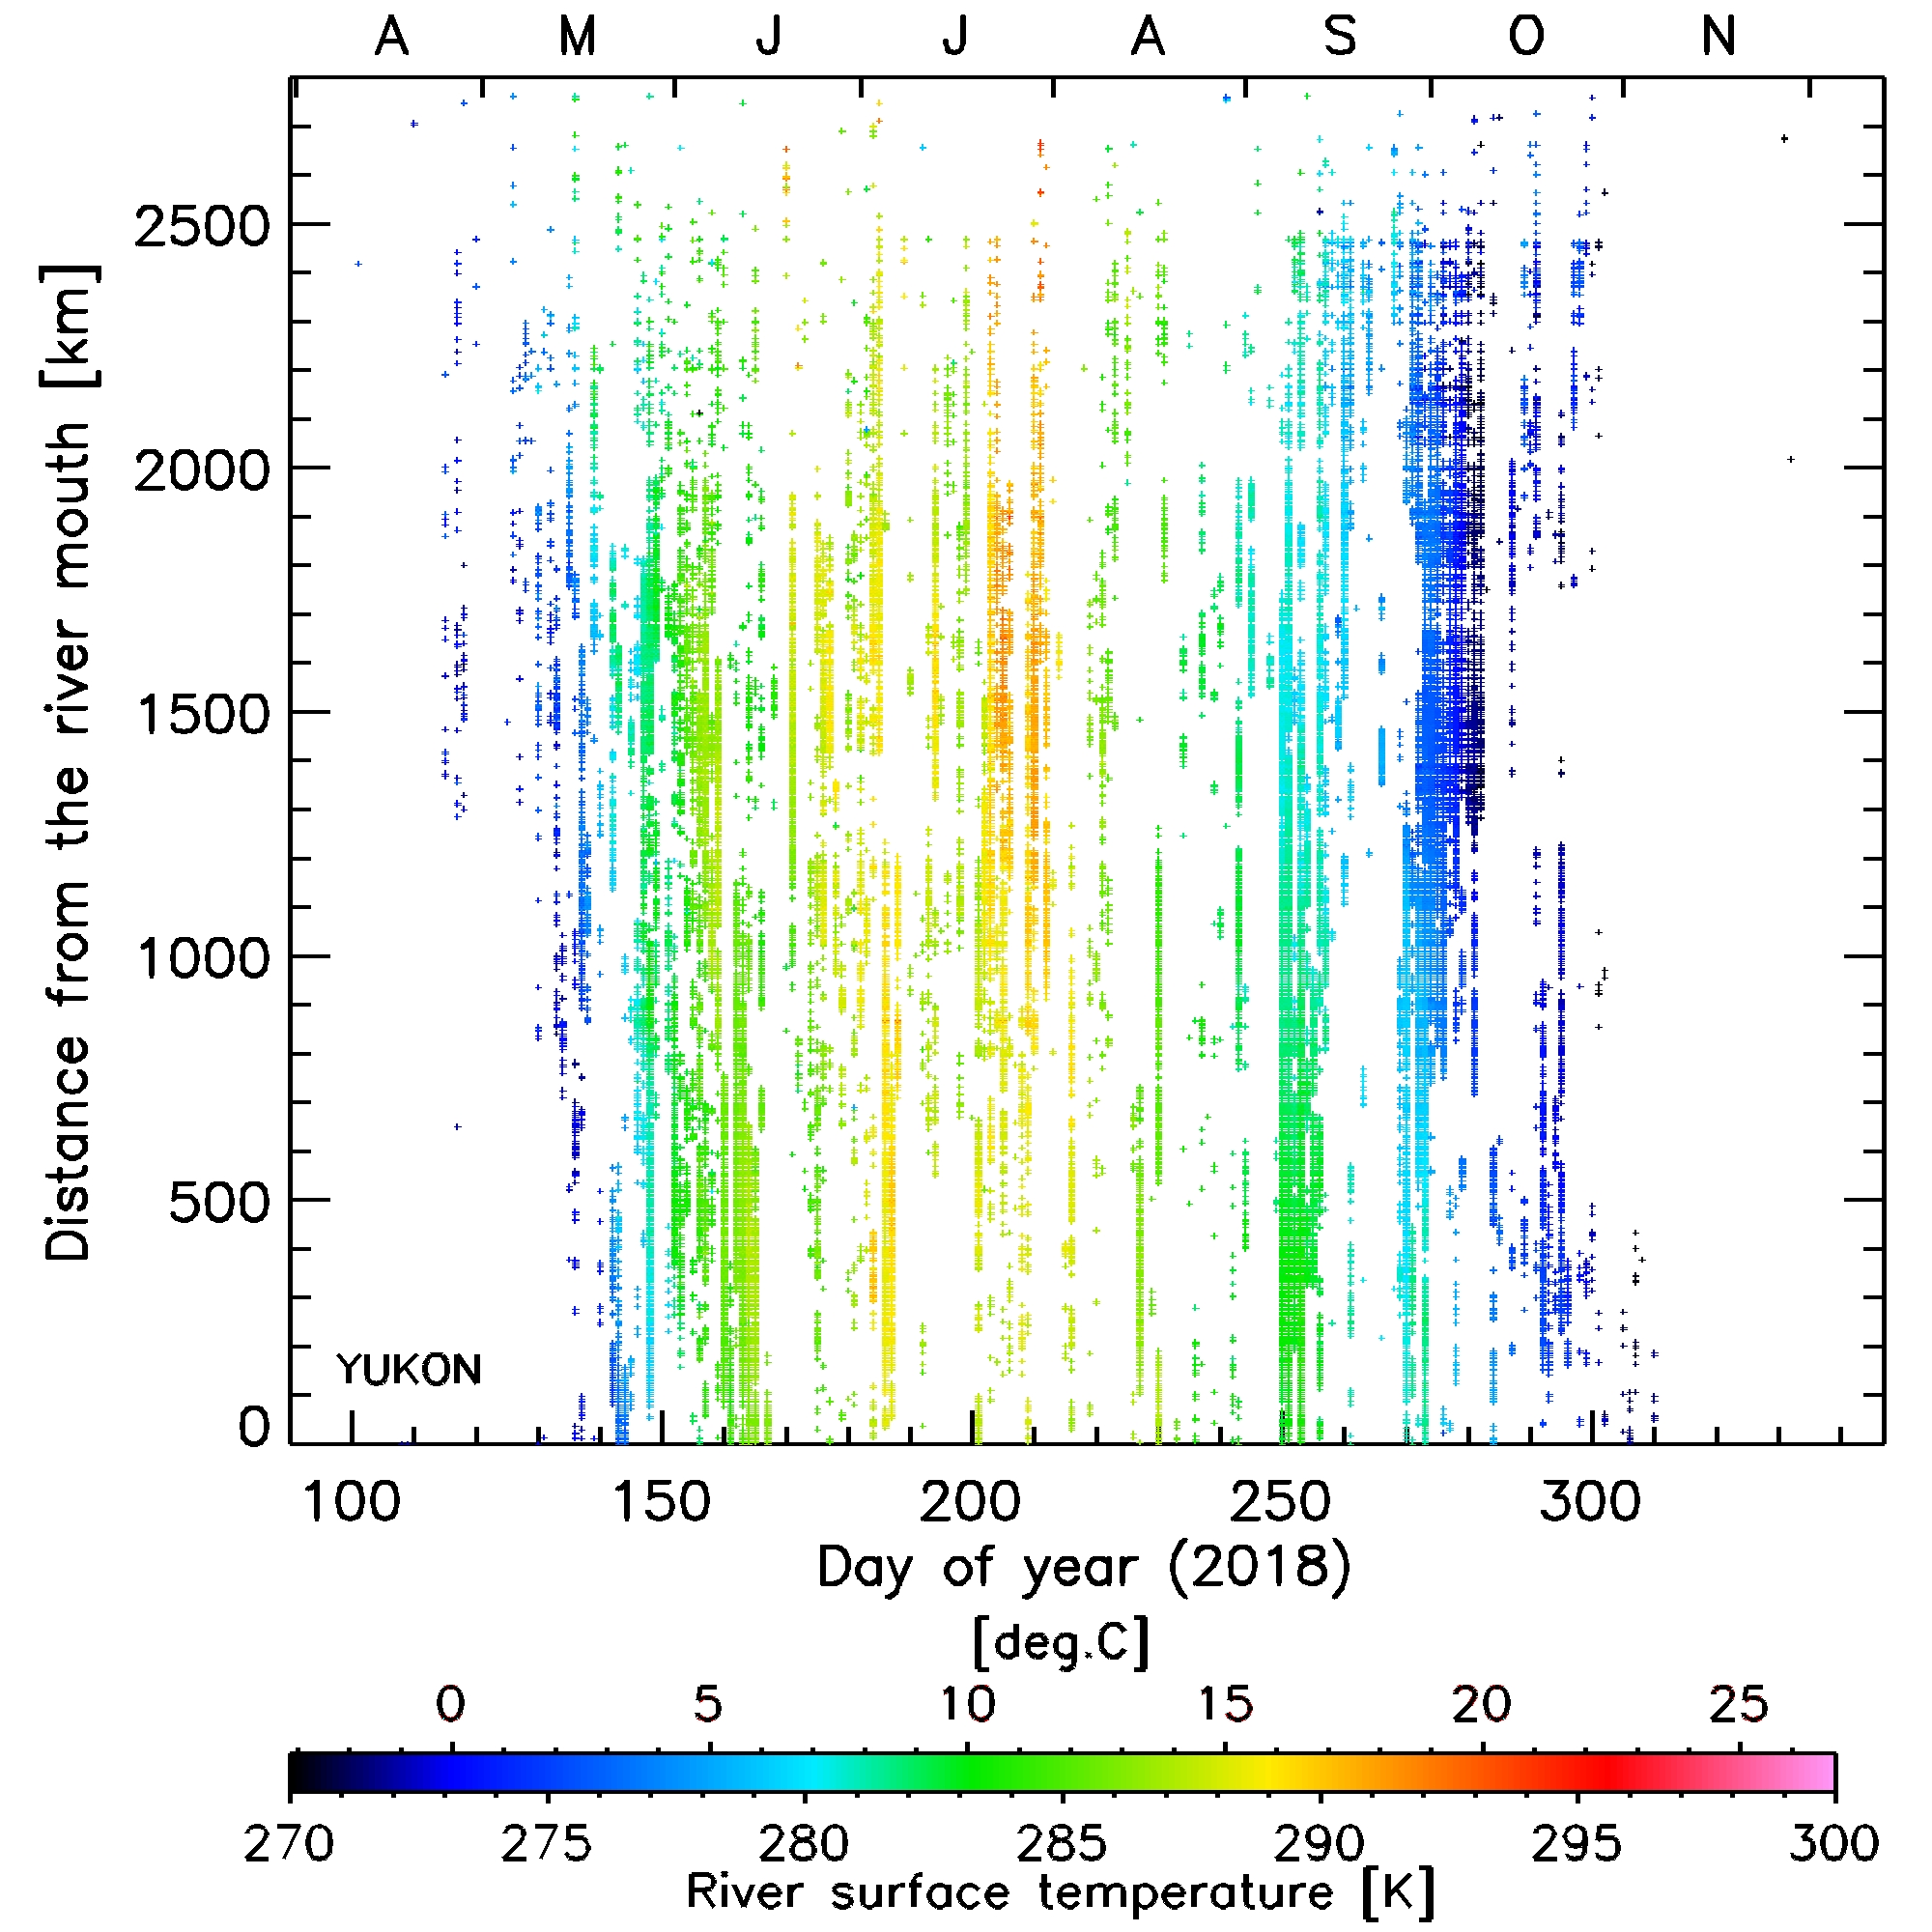
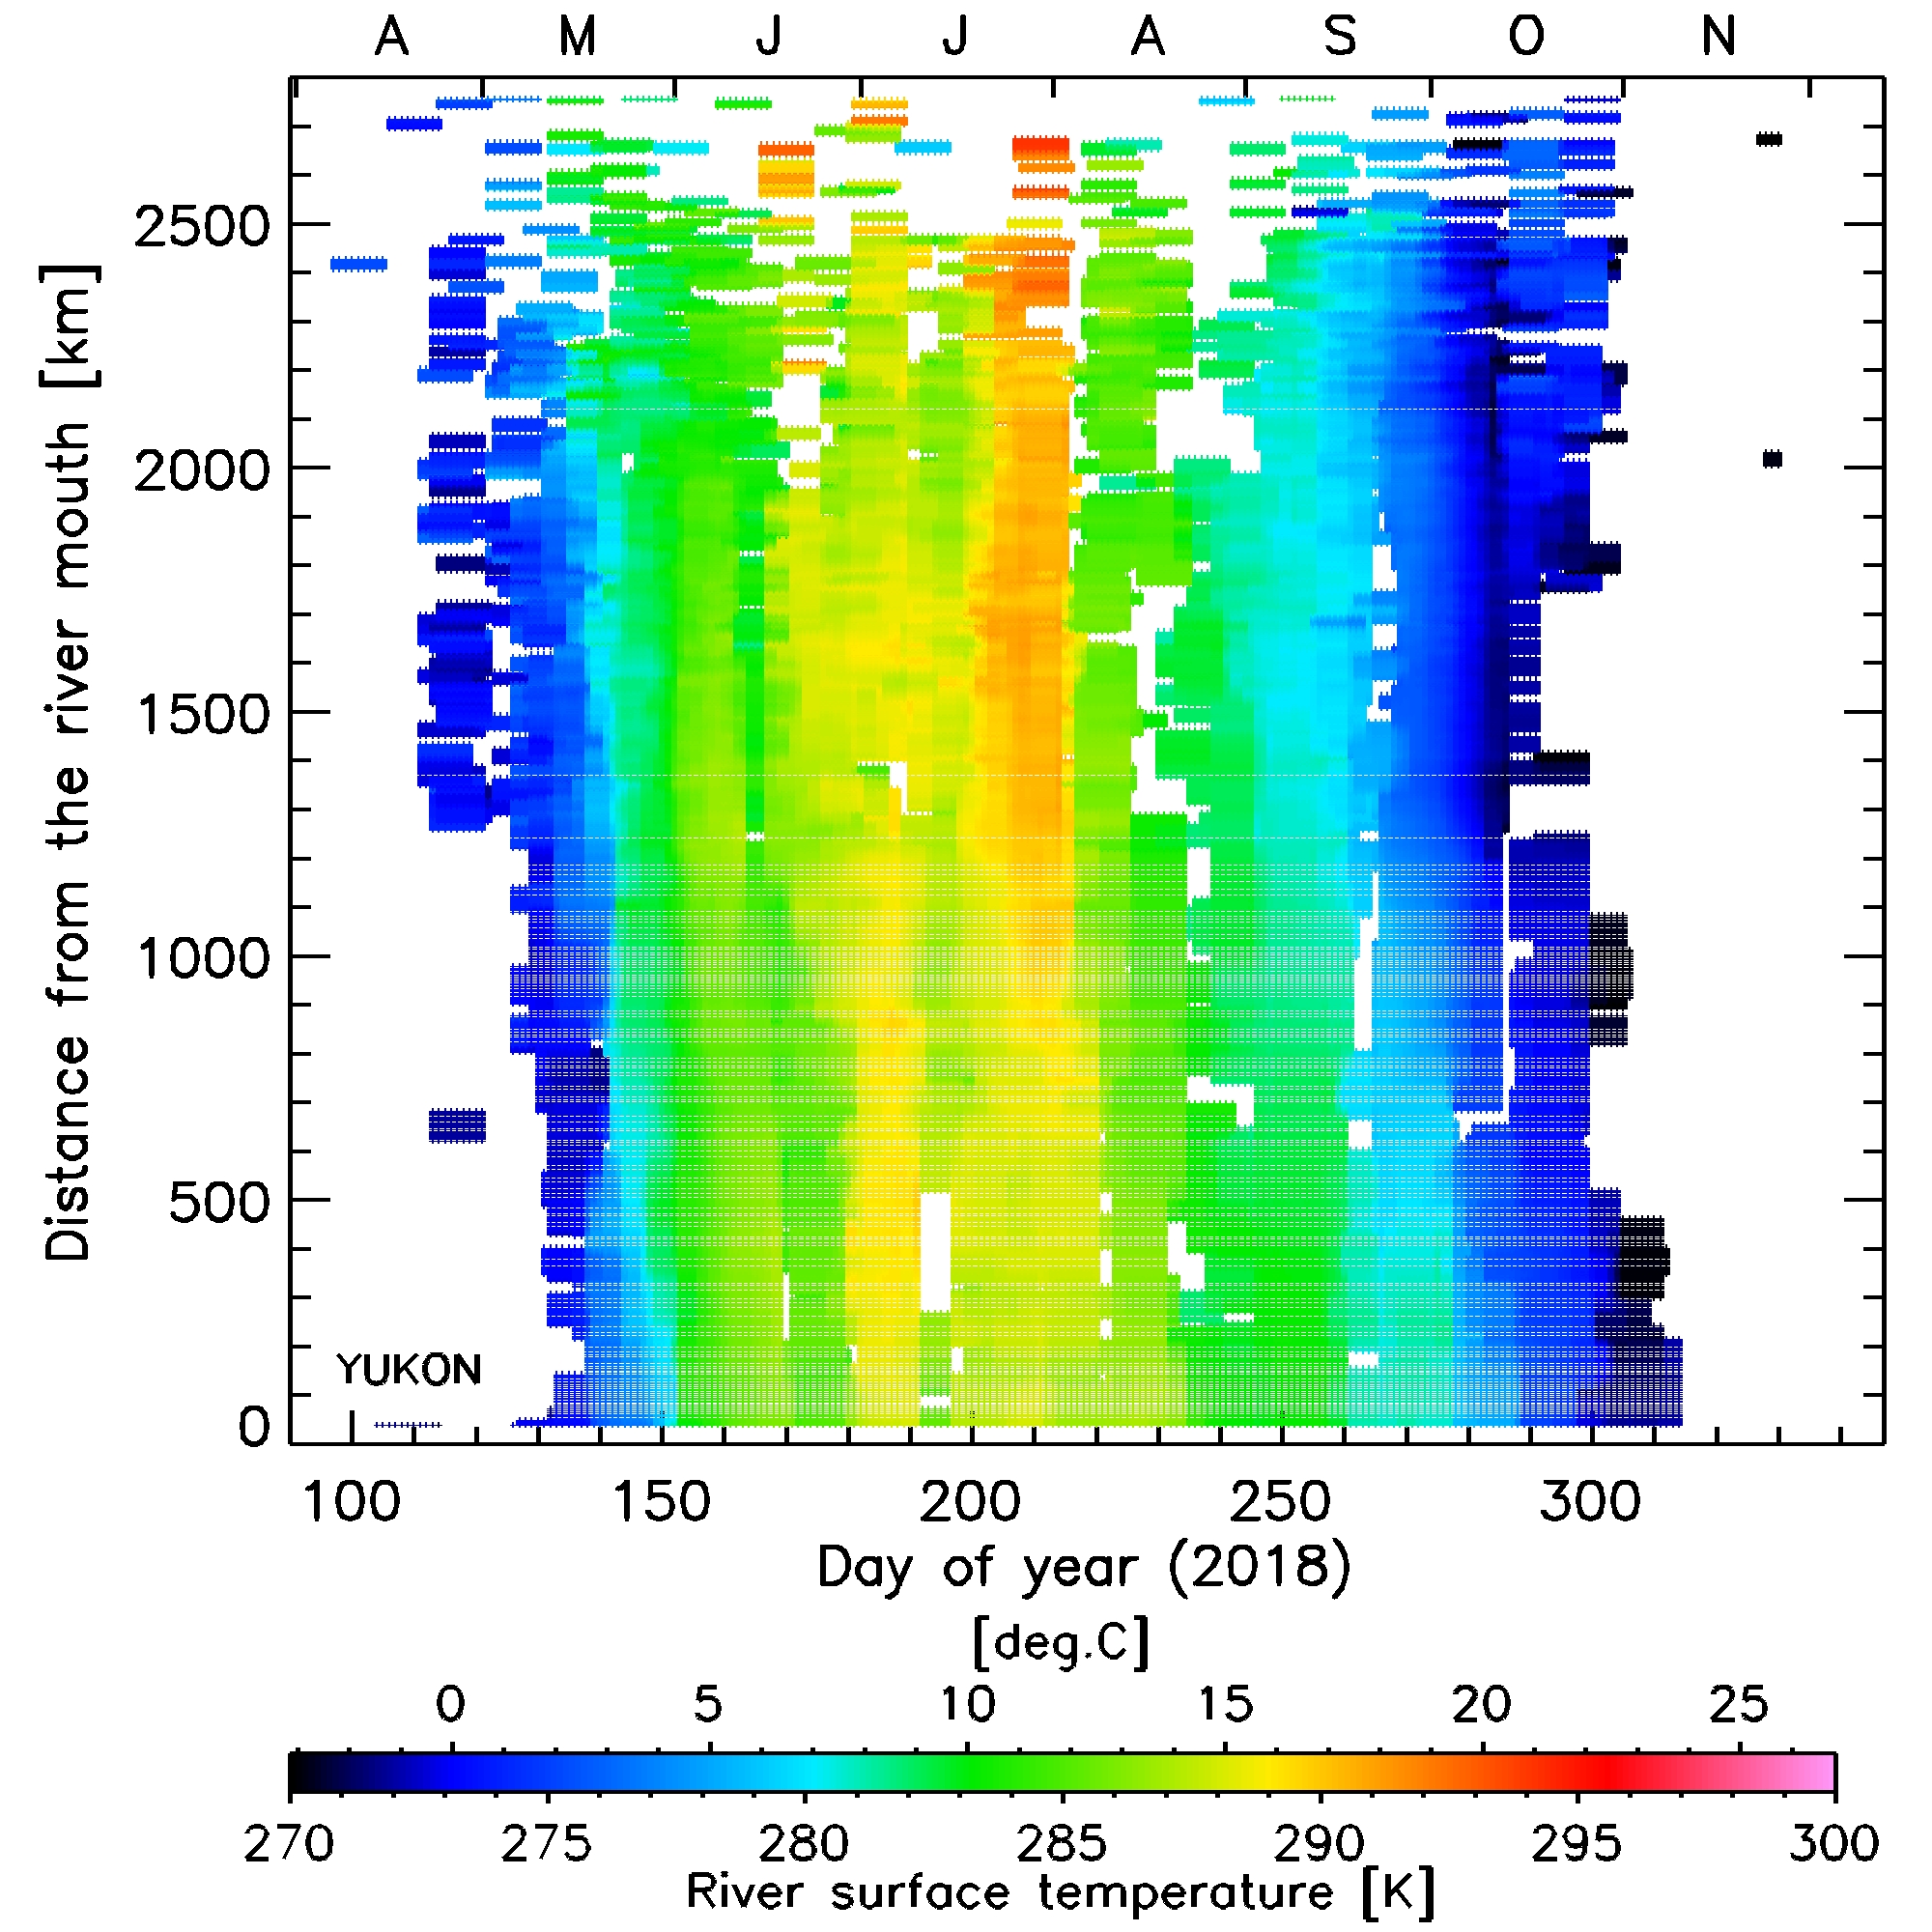
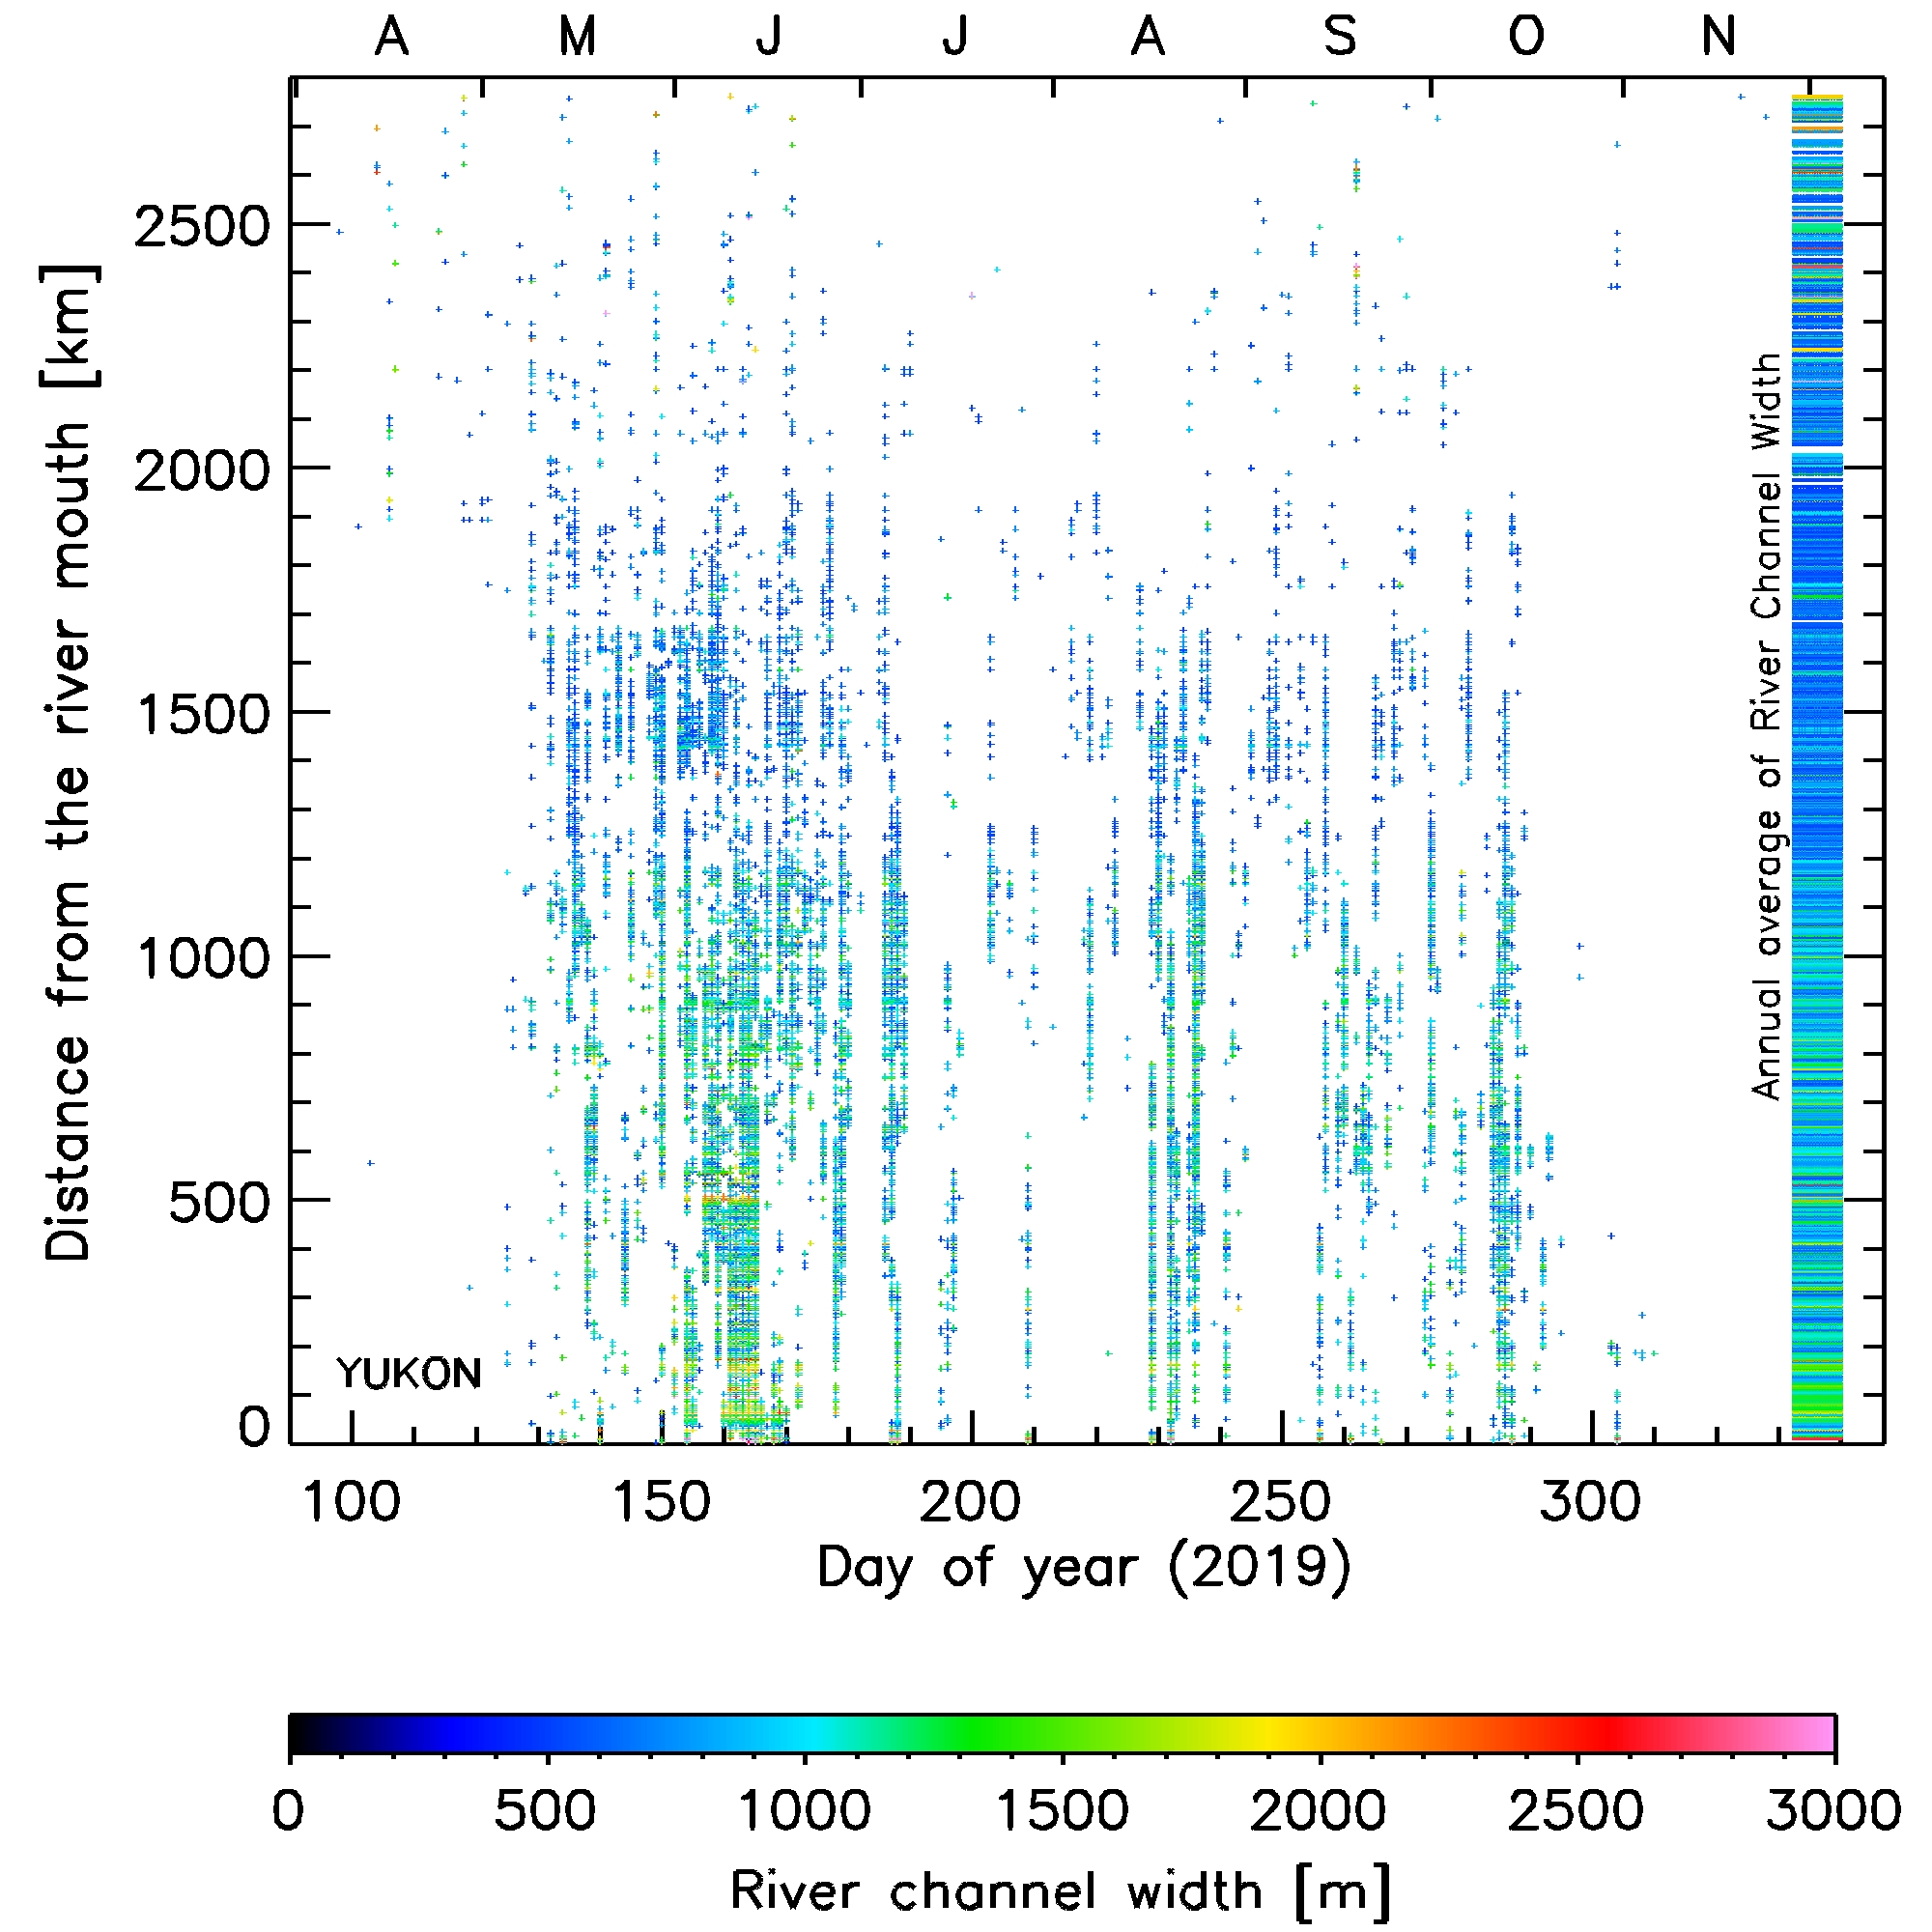
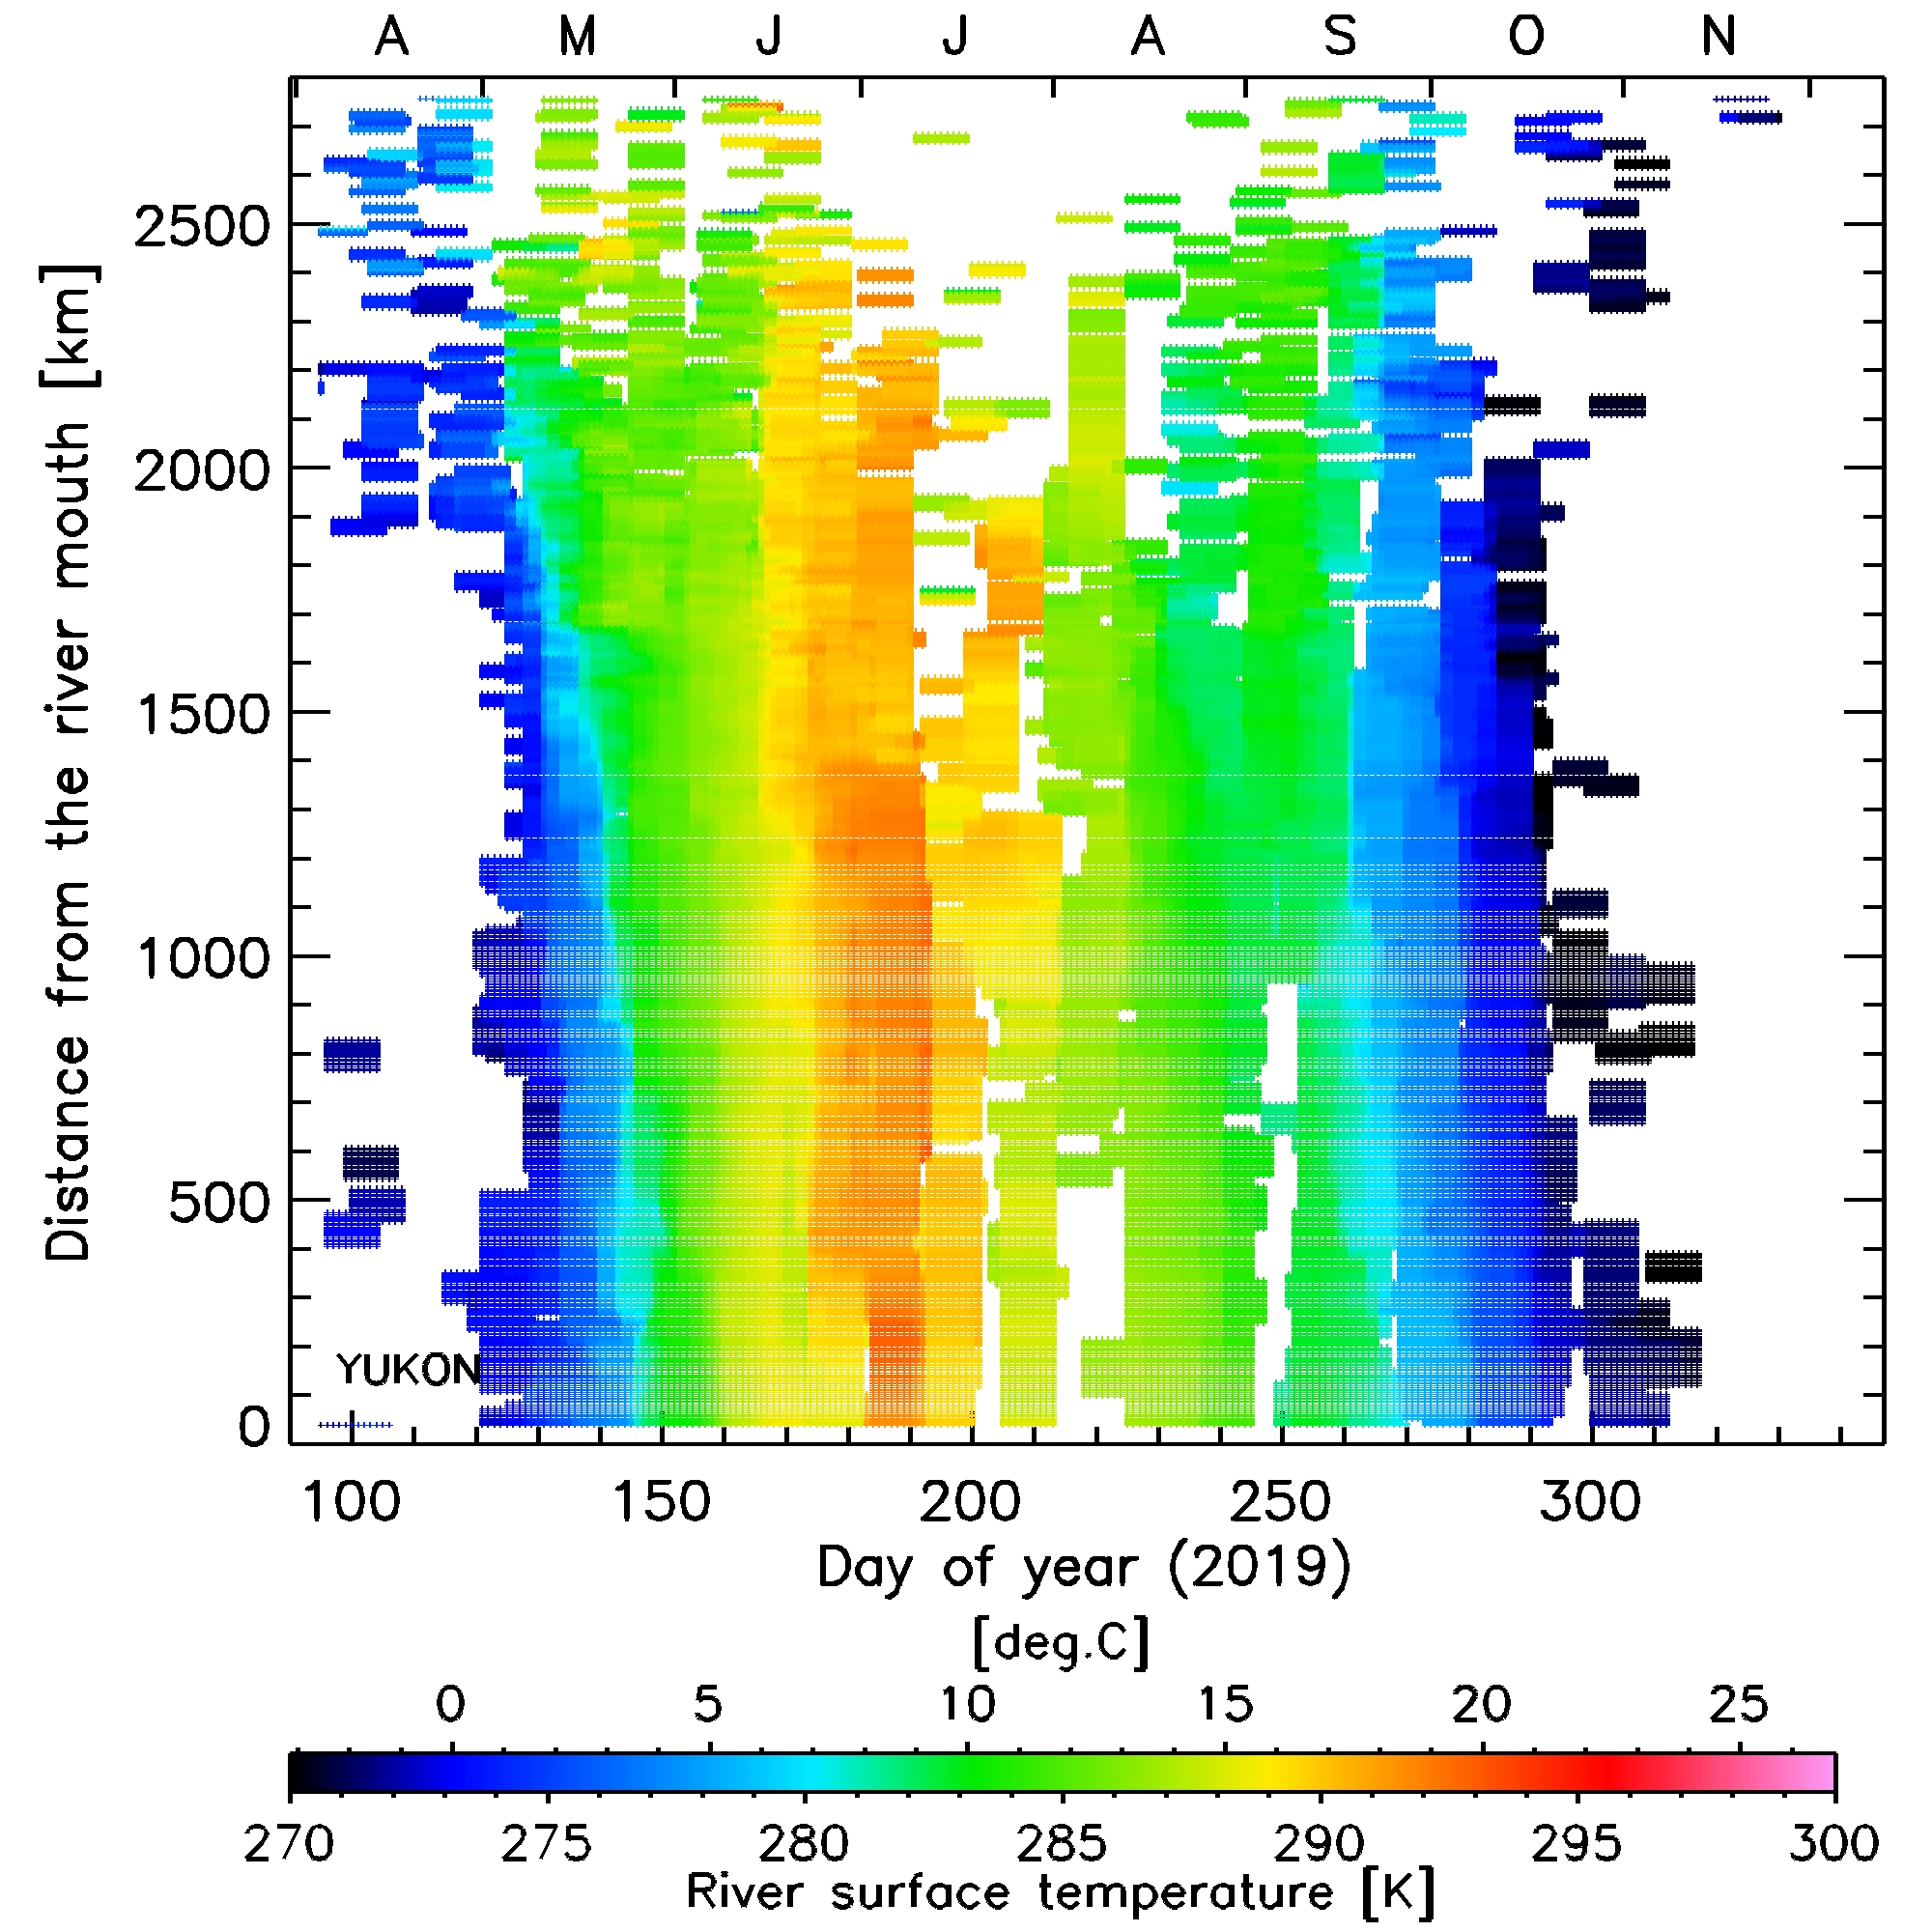
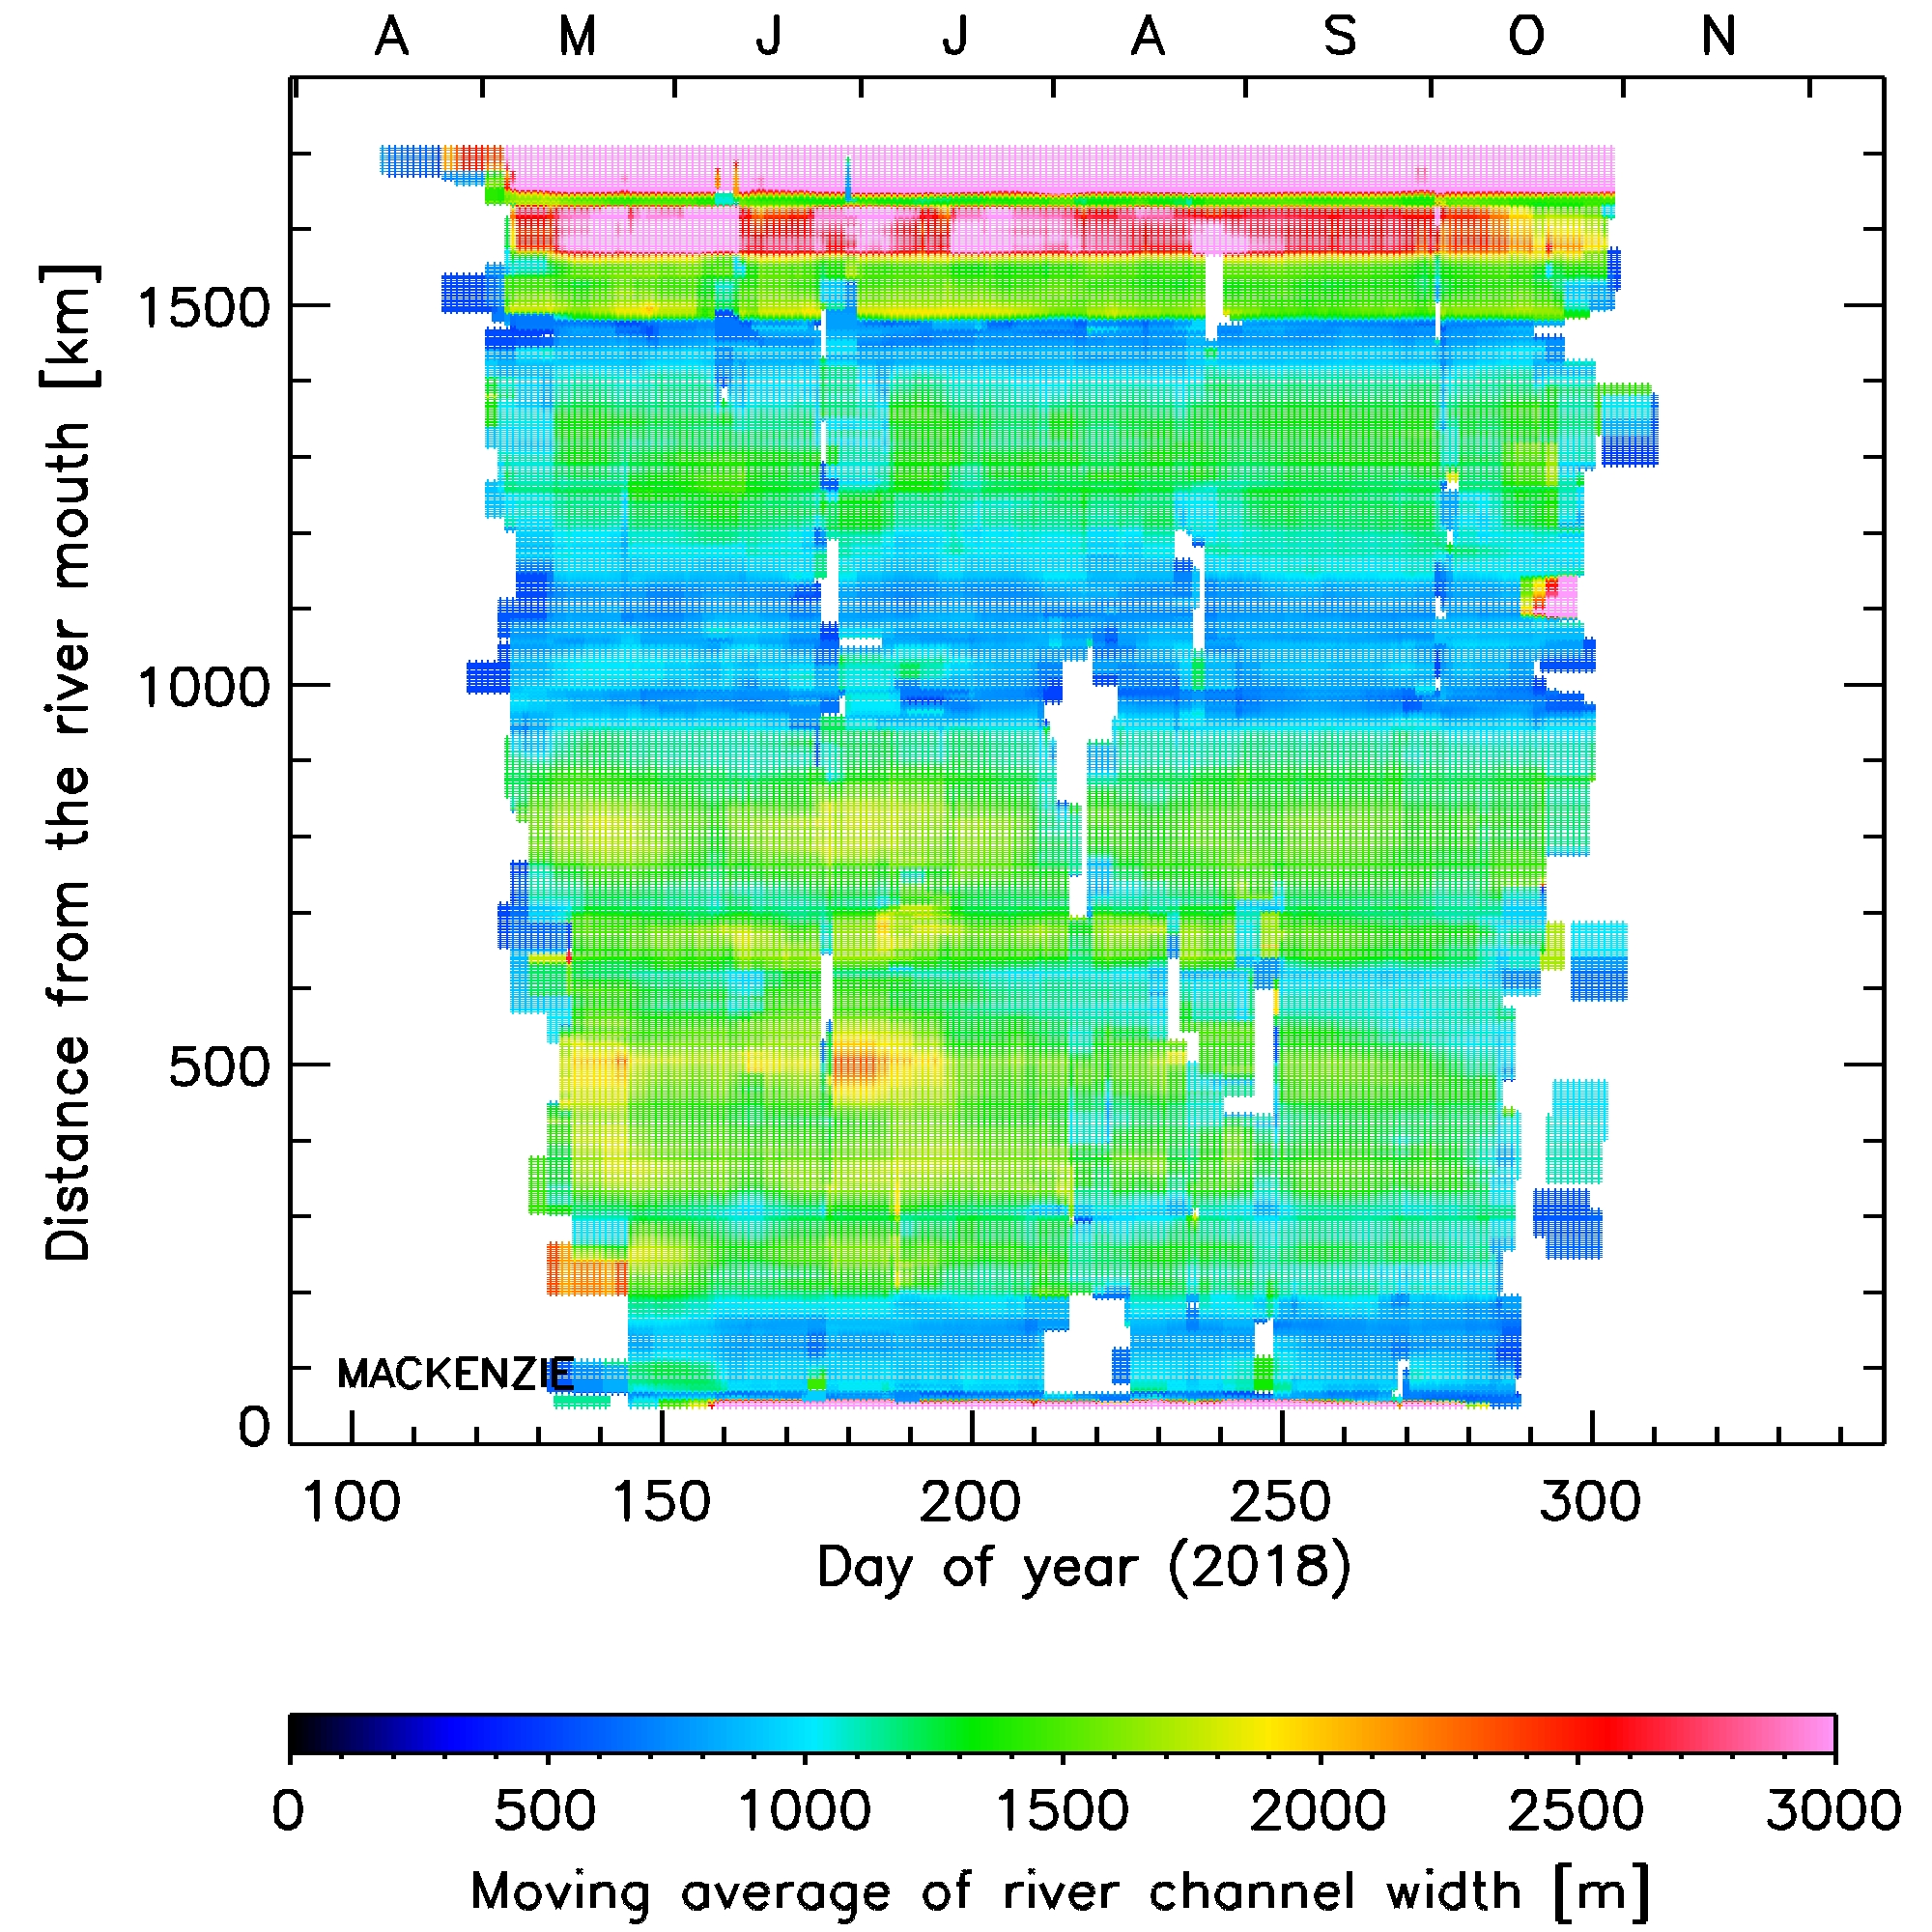
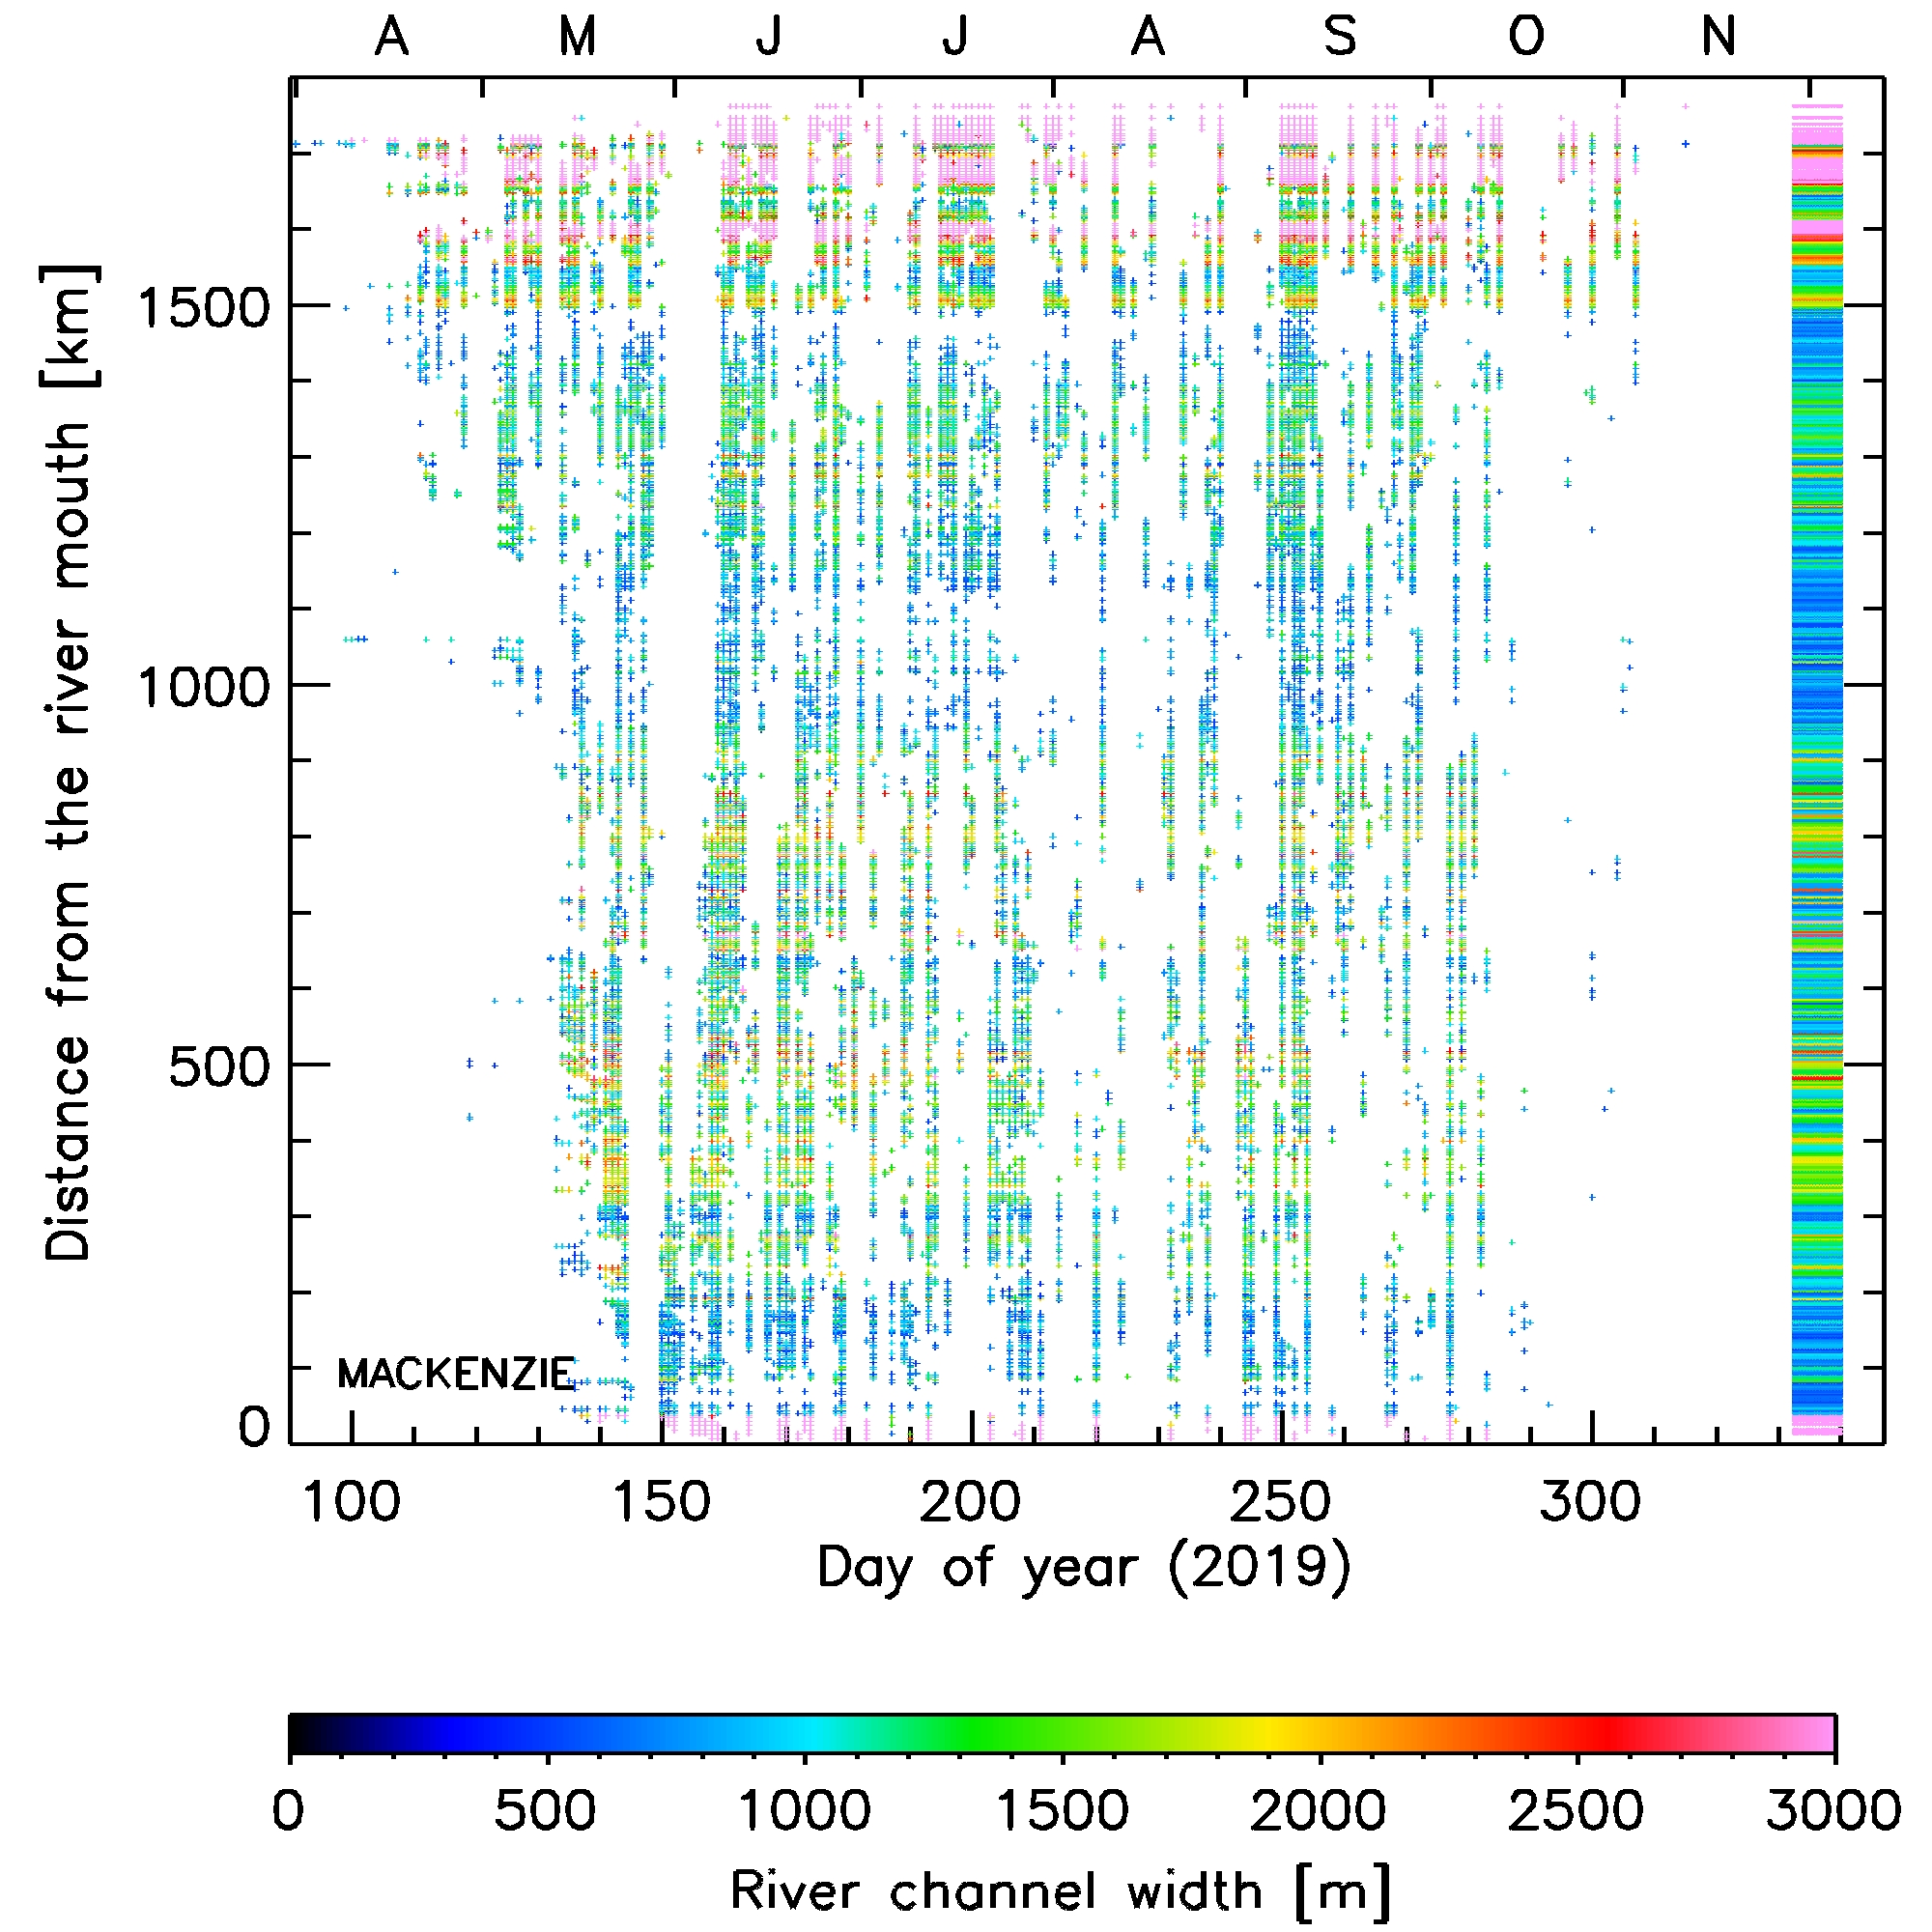
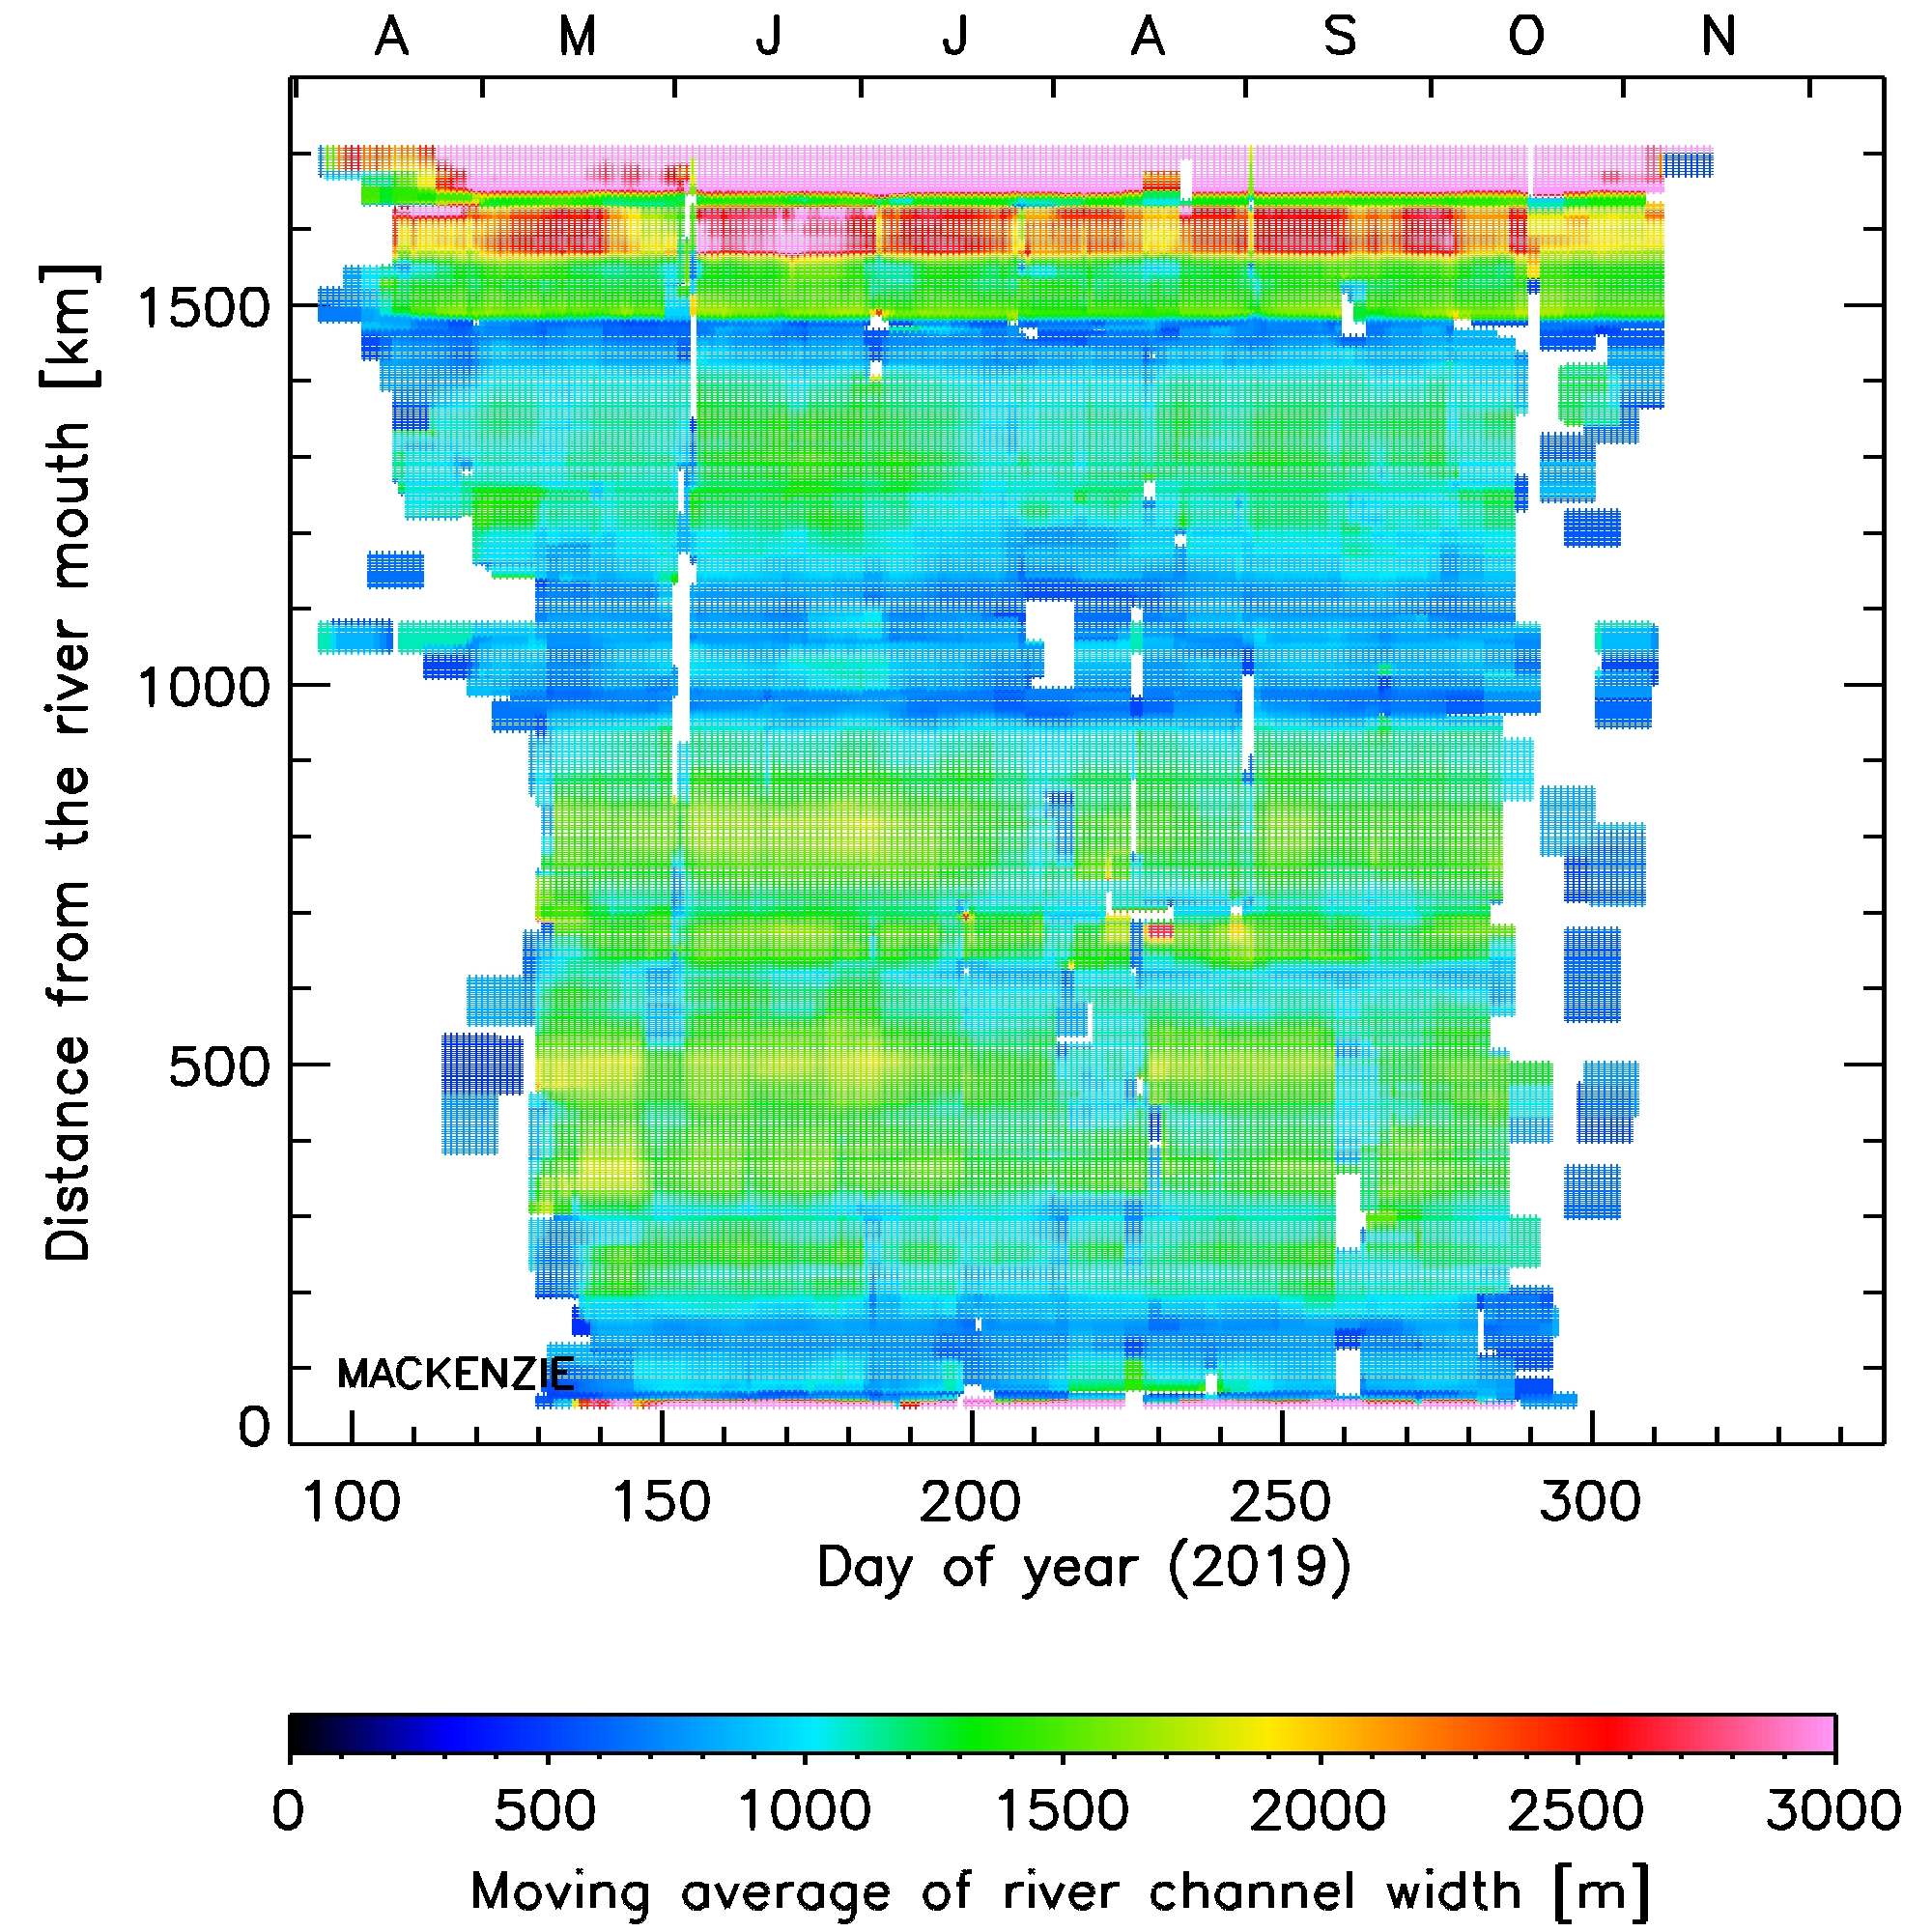
Data descriptions: River surface temperature (RST) and river channel width (RCW) are retrieved along the main channels of the six Arctic rivers (Ob, Yenisei, Lena, Kolyma, Yukon, Mackenzie) as shown in the Map. RST means river surface brightness temperature (RSBT, unit: Kelvin) obtained with the thermal band (T1) of GCOM-C/SGLI without the correction of the atmospheric effects. RCW means the width of river channel estimated as the number of water pixels crossing perpendicular to the river flow direction (unit: the number of pixels). RCW in meter can be obtained by multiplying the number of pixel by the pixel size (249.75 m/pixel). There are two files for each data. One is "daily" data containing RST or RCW along the river channels retrieved only under clear sky condition. When RST and RCW is not available due to cloudy or river ice cover, a fill value of -999.0 is stored. The other is the data with moving average. Spatio-temporal interpolation of RST and RCW with the averaging window of 9-days and 29-grid points (corresponding to approx. 40 km in river stream length on average) was performed to fill the gap due to cloud covers and to derive near-daily smoothed distributions of RCW and RST along the river channels.
Data format: RST and RCW data are stored in a sequential ascii file. Each line contains the following items with the fortran like format of "(2F10.3, 2F10.5, 244F12.4)";
Line 1: Titles of each items
Line 2-the end of file: Distance from the river month (km), Height (meter), Longitude (degree), Latitude (degree), RST of Apr. 1st (day091), RST of Apr. 2nd (day092), ... , RST of Nov. 30 (day334).
| River | Spatial resol. | Period [click to download data and image] | Temporal Resol. | Format | Satellite Sensors | |
| Ob (Russia) | 1-2 km interval |
2018 (Apr.-Nov.) [RST data (daily)] [jpg] 2018 (Apr.-Nov.) [RST data (moving average)] [jpg] 2019 (Apr.-Nov.) [RST data (daily)] [jpg] 2019 (Apr.-Nov.) [RST data (moving average)] [jpg] 2018 (Apr.-Nov.) [RCW data (daily)] [jpg] 2018 (Apr.-Nov.) [RCW data (moving average)] [jpg] 2019 (Apr.-Nov.) [RCW data (daily)] [jpg] 2019 (Apr.-Nov.) [RCW data (moving average)] [jpg] |
Daily | Ascii | SGLI | |
| Yenisei (Russia) | 1-2 km interval |
2018 (Apr.-Nov.) [RST data (daily)] [jpg] 2018 (Apr.-Nov.) [RST data (moving average)] [jpg] 2019 (Apr.-Nov.) [RST data (daily)] [jpg] 2019 (Apr.-Nov.) [RST data (moving average)] [jpg] 2018 (Apr.-Nov.) [RCW data (daily)] [jpg] 2018 (Apr.-Nov.) [RCW data (moving average)] [jpg] 2019 (Apr.-Nov.) [RCW data (daily)] [jpg] 2019 (Apr.-Nov.) [RCW data (moving average)] [jpg] |
Daily | Ascii | SGLI | |
| Lena (Russia) | 1-2 km interval |
2018 (Apr.-Nov.) [RST data (daily)] [jpg] 2018 (Apr.-Nov.) [RST data (moving average)] [jpg] 2019 (Apr.-Nov.) [RST data (daily)] [jpg] 2019 (Apr.-Nov.) [RST data (moving average)] [jpg] 2018 (Apr.-Nov.) [RCW data (daily)] [jpg] 2018 (Apr.-Nov.) [RCW data (moving average)] [jpg] 2019 (Apr.-Nov.) [RCW data (daily)] [jpg] 2019 (Apr.-Nov.) [RCW data (moving average)] [jpg] |
Daily | Ascii | SGLI | |
| Kolyma (Russia) | 1-2 km interval |
2018 (Apr.-Nov.) [RST data (daily)] [jpg] 2018 (Apr.-Nov.) [RST data (moving average)] [jpg] 2019 (Apr.-Nov.) [RST data (daily)] [jpg] 2019 (Apr.-Nov.) [RST data (moving average)] [jpg] 2018 (Apr.-Nov.) [RCW data (daily)] [jpg] 2018 (Apr.-Nov.) [RCW data (moving average)] [jpg] 2019 (Apr.-Nov.) [RCW data (daily)] [jpg] 2019 (Apr.-Nov.) [RCW data (moving average)] [jpg] |
Daily | Ascii | SGLI | |
| Yukon (USA) | 1-2 km interval |
2018 (Apr.-Nov.) [RST data (daily)] [jpg] 2018 (Apr.-Nov.) [RST data (moving average)] [jpg] 2019 (Apr.-Nov.) [RST data (daily)] [jpg] 2019 (Apr.-Nov.) [RST data (moving average)] [jpg] 2018 (Apr.-Nov.) [RCW data (daily)] [jpg] 2018 (Apr.-Nov.) [RCW data (moving average)] [jpg] 2019 (Apr.-Nov.) [RCW data (daily)] [jpg] 2019 (Apr.-Nov.) [RCW data (moving average)] [jpg] |
Daily | Ascii | SGLI | |
| Mackenzie (Canada) | 1-2 km interval |
2018 (Apr.-Nov.) [RST data (daily)] [jpg] 2018 (Apr.-Nov.) [RST data (moving average)] [jpg] 2019 (Apr.-Nov.) [RST data (daily)] [jpg] 2019 (Apr.-Nov.) [RST data (moving average)] [jpg] 2018 (Apr.-Nov.) [RCW data (daily)] [jpg] 2018 (Apr.-Nov.) [RCW data (moving average)] [jpg] 2019 (Apr.-Nov.) [RCW data (daily)] [jpg] 2019 (Apr.-Nov.) [RCW data (moving average)] [jpg] |
Daily | Ascii | SGLI |
Reference: